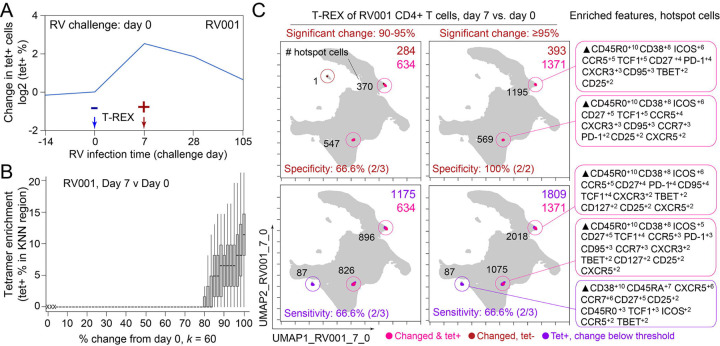
Figure 2 – T-REX identifies molecular signatures of CD4+ T cells that are expanded during acute rhinovirus infection and enriched for virus-specific cells.
A subject (RV001) was experimentally infected with rhinovirus (RV-A16) and CD4+ T cell signatures monitored by spectral flow cytometry in conjunction with tetramer staining during the course of infection. (A) Fold change in the number of tetramer-positive cells (log2) after rhinovirus challenge on day 0. (B) Data showing the percentage of tetramer+ cells in each cell’s KNN region (where k = 60) plotted against the percentage change in its KNN region on day 7 vs. day 0. A statistical threshold of 80% or higher for the percentage change in KNN region corresponded to marked enrichment of tetramer+ cells at day 7. (C) UMAP plots with T-REX analysis of CD4+ T cells for day 7 vs. day 0 based on statistical thresholds of 90–95% change (left column) and ≥95% change (right column) in cell phenotypes. Pink and red colors denote regions of phenotypic change identified by T-REX. Numbers of tetramer+ cells within the cell’s KNN region captured in these areas of phenotypic change are denoted. Cells containing >5% tetramer+ virus-specific cells in the corresponding KNN region were labeled pink. Red cells denote a KNN region that was not enriched for tetramer+ cells, and purple cells denote a tetramer enriched region not captured by T-REX. Values in black indicate the actual number of tetramer+ cells in each circled hotspot of phenotypic change. MEM labels on the right indicate cell phenotypes of each hotspot.

