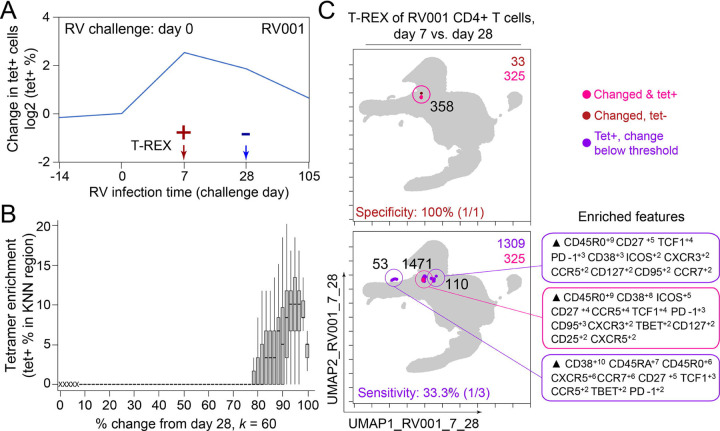
Figure 5 – Infected cell phenotypes can be compared to cells taken after infection to reveal regions of expansion.
(A) Fold change in the number of tetramer-positive cells (log2) after rhinovirus challenge on day 0. (B) Box and whisker plot show KNN regions in terms of expansion during infection represented by percent change as well as percent of tetramer positive cells for post-infection (day 28) and during infection (day 7). (C) UMAP plots for 95 percent change and 5 percent tetramer cutoffs. Cell count is in black as well as in the upper right of each UMAP plot. MEM labels are given for highly expanded and tetramer-enriched regions.

