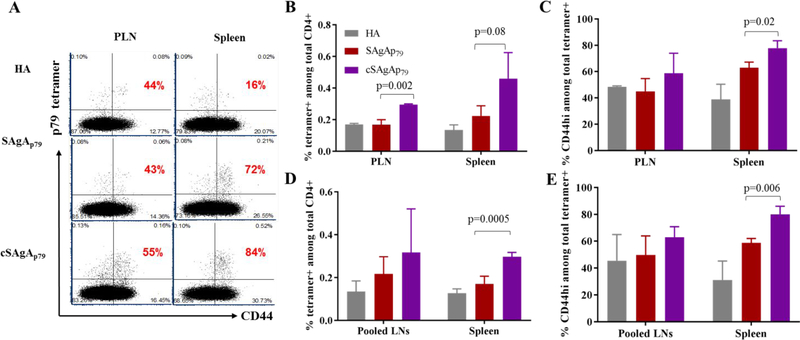
Figure 9:
In vivo p79-specific T cell responses to SAgAp79 and cSAgAp79 as compared to HA control analyzed with 2.5/p79 MHC tetramer. (A) Representative dot plots showing tetramer+ T cells and their expression of activation marker CD44 (gated on CD4+ T cells) in PLN and spleen, three days after two s.c. injections, three days apart. The percentage of CD44hi cells among tetramer+ CD4+ T cells is indicated in red on each plot. (B,C) Increased frequency of p79-specific endogenous CD4+ T cells (B), and percentage of CD44hi cells among them (C) under the same conditions as (A). (D,E) Increased frequency of p79-specific endogenous CD4+ T cells (D), and percentage of CD44hi cells among them (E) in pooled lymph nodes and spleen, three days after 3 weekly s.c. injections. Bar graphs show the mean ± SD (n=3mice). Student’s t-test was used to determine the p values.

