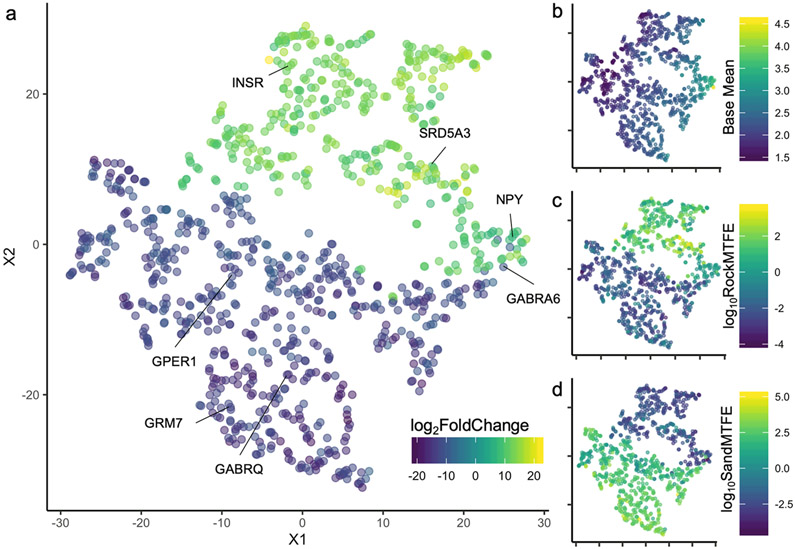
Figure 5:
t-SNE plot showing the overall relationship between the 993 genes significant in the three-way interaction with 8 immunoprecipitated and 8 input samples per gene. Genes that are clustered closer together exhibit a similar pattern of expression across samples. a) Color scale is the log2FoldChange for each gene in the three-way interaction. b) Color scale depicts the base mean, i.e. the mean of normalized counts of all samples, normalizing for sequencing depth. c) Color scale depicts the log10 average fold-enrichment values for the rock species (PC) in the mirror test relative to rock species in the control condition. This pattern is highly similar to the log2FoldChange. d) Color scale depicts the log10 average fold-enrichment values for the sand species (MC) in the mirror test relative to sand species in the control condition.

