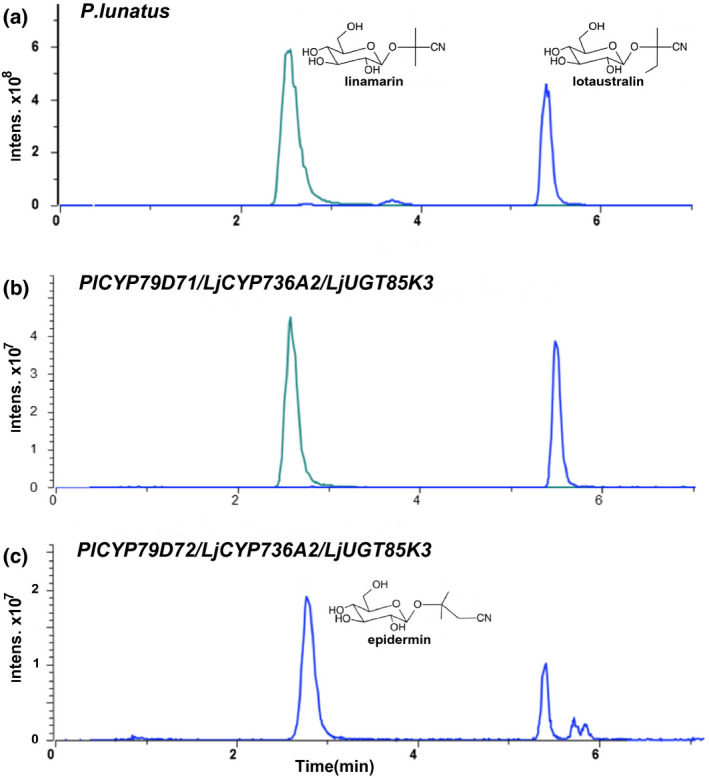
FIGURE 2.

Extracted ion chromatograms of linamarin and lotaustralin production in the leaves of P. lunatus and following co‐expression of PlCYP79D71 in N. benthamiana. (a) Metabolic profile of a young P. lunatus leaf. (b) Metabolic profile of infiltrated tobacco leaves co‐expressing CYP79D71 from P. lunatus, with CYP736A2 and UGT85K3 from L. japonicus. (c) Metabolic profile of infiltrated tobacco leaves co‐expressing CYP79D72 from P. lunatus, with CYP736A2 and UGT85K3 from L. japonicus. Extracted ion peaks are for sodium adducts: linamarin (m/z 270, cyan), lotaustralin (m/z 284, blue), epidermin (at 2.7 min in panel c, m/z 284, blue)
