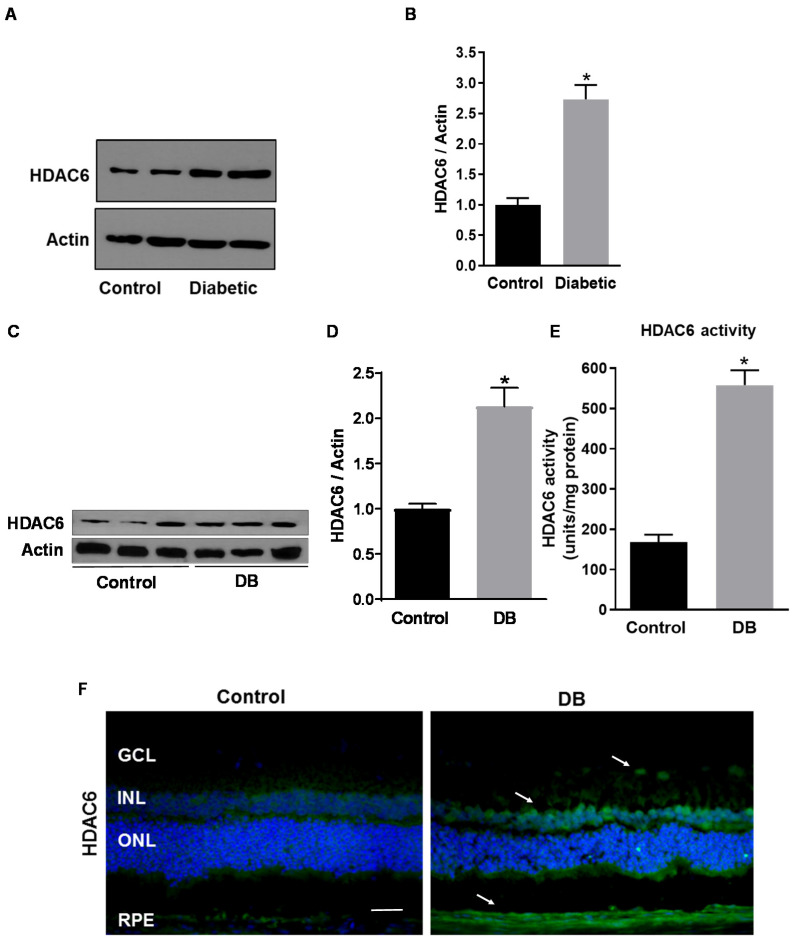
Figure 1.
Histone deacetylase 6 (HDAC6) expression in the diabetic retina. (A) Western blotting analysis measuring HDAC6 protein levels in human postmortem retinas from diabetic and non-diabetic donors (control). (B) Bar histograms representing relative optical densities from the immunoblotting shown in (A) and normalized versus the loading control actin. Values are expressed as mean ± SEM for n = 8. * p < 0.01 vs. control. (C) Western analysis of HDAC6 protein expression in retinas of streptozotocin-induced diabetic rats (STZ-rats) (DB) at 8 weeks of hyperglycemia and age-matched normoglycemic control rats (control). (D) Bar histograms representing densitometric quantification of HDAC6 protein levels normalized to actin. (E) HDAC6 activity measured, by a fluorimetric assay, in retinas of STZ-rats and control normoglycemic rats. (F) Representative microimages of immunohistochemical analysis of HDAC6 (green) in retinas of STZ-rats at 8 weeks of hyperglycemia and of age-matched normoglycemic control rats. Nuclei were stained with 4′,6-diamidino-2-phenylindole (DAPI). White arrows indicate areas of increased immunoreactivity. Scale bar, 50 µm. Values are expressed as mean ± SEM for n = 6. * p < 0.01 vs. control.

