Figure 5.
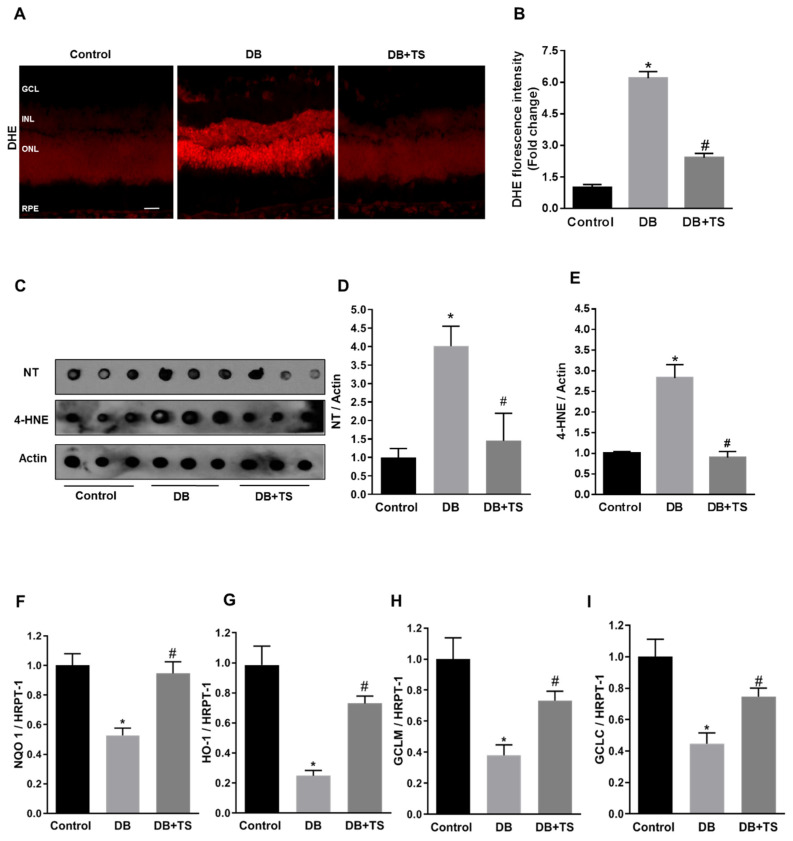
Effects of Tubastatin A on retinal redox homeostasis. (A) Representative images of retinal cryosections from the different experimental groups (control, DB and DB + TS) probed with dihydroethidium (DHE) to detect superoxide. Scale bar, 50 μm. (B) Quantification of relative fluorescence intensity of DHE staining. Values are mean ± SEM for n = 6. Results are presented as a fold change of control. * p < 0.01 vs. control and # p < 0.01 vs. DB. (C) Dot blot analysis assessing levels of nitrotyrosine (NT) and 4-hydroxynonenal (4-HNE) in retinas of three experimental groups (control, DB and DB + TS rats). (D,E) Quantification of optical density of NT and 4-HNE immunoblotting normalized versus actin. Values are mean ± SEM for n = 6. * p < 0.05 vs. control and # p < 0.05 vs. DB for NT. * p < 0.01 vs. control and # p < 0.01 vs. DB for 4-HNE. (F–I) mRNA levels of heme oxygenase-1 (HO-1), NAD(p)H dehydrogenase quinone 1 (NQO1), glutamate-cysteine ligase regulatory subunit (GCLM) and glutamate-cysteine ligase (GCLC) evaluated by qPCR and normalized to mRNA for hypoxanthine phosphoribosyltransferase 1 (HPRT-1). Values are mean ± SEM for n = 6. * p < 0.05 vs. control and # p < 0.05 vs. DB.

