Figure 7.
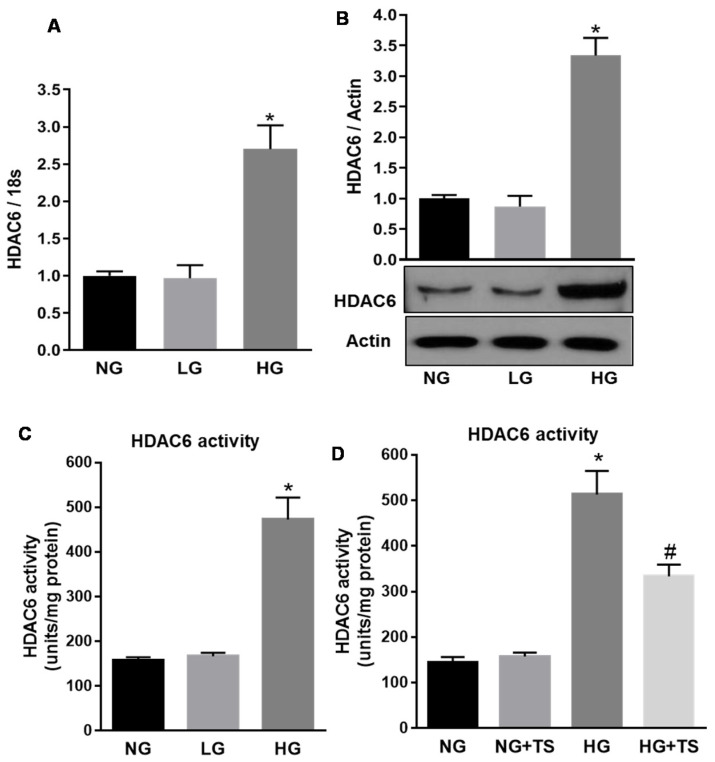
Effects of high glucose and Tubastatin A on HDAC6 expression and activity in HuREC. (A) HDAC6 mRNA expression, measured by qPCR, in HuREC exposed to different glucose levels (NG = 5.5 mM d-glucose, HG = 25 mM d-glucose) and the osmotic control l-glucose (25 mM) for 48 and 72 h. (B) Immunoblotting showing HDAC6 protein levels measured 48 h after exposure of HuREC to HG or the controls NG or LG. (C) HDAC6 activity measured in HuREC by fluorimetric assay at 48 h exposure of the cells to HG, NG or LG. (D) HDAC6 activity measured in HuREC by fluorimetric assay after 48 h of exposure of the cells to HG or HG plus TS (5 µM starting 6 h before HG treatment) and compared to the controls NG or LG. Values are mean ± SEM for n = 3. * p < 0.01 vs. NG and # p < 0.01 vs. HG.

