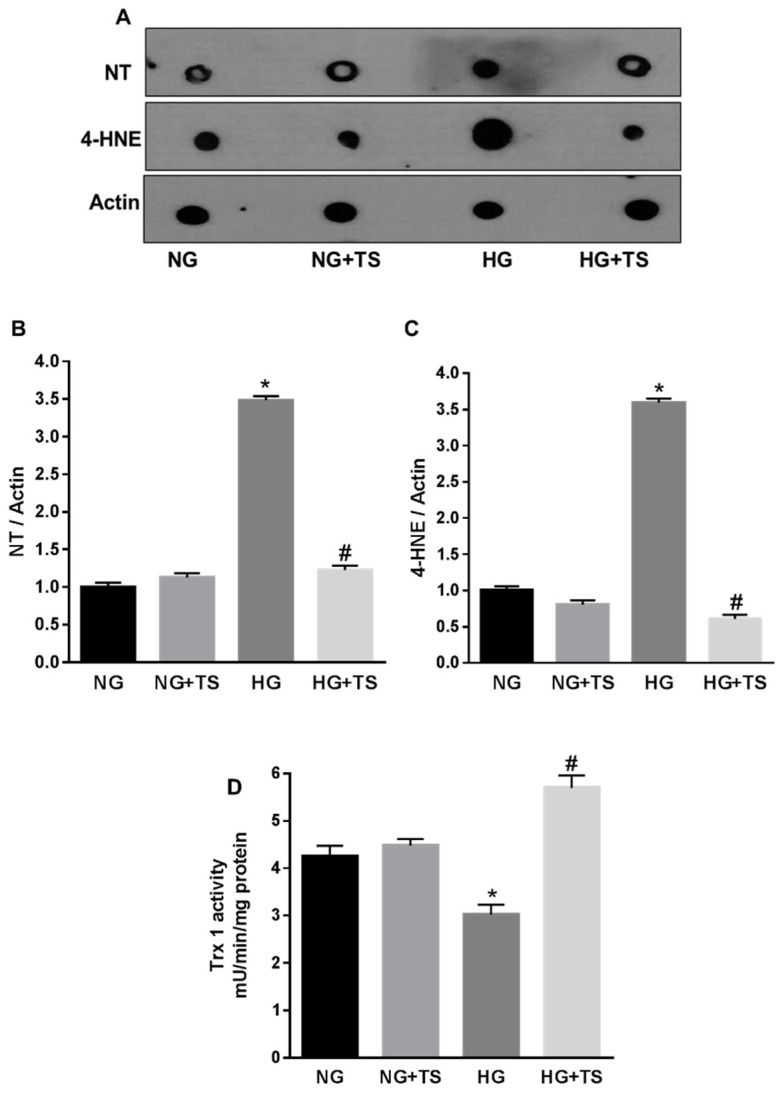
Figure 9.
Effects of Tubastatin A on high glucose-induced redox imbalance in HuREC. (A) Representative images of dot blot analysis demonstrating nitrotyrosine (NT) and 4-hydroxynonenal (4-HNE) formation in HuREC exposed to HG for 48 h or HG in the presence of 5 µM of TS (HG + TS), also for 48 h, and compared to HuREC cultured in NG conditions in the absence (NG) or presence of 5 µM TS (NG + TS). (B,C) Quantification of optical density of NT and 4-HNE immunoblotting normalized versus actin. Values are mean ± SEM for n = 3. * p < 0.0001 vs. NG and # p < 0.0001 vs. HG. (D) Fluorimetric assay results representing Trx-1 activity in HuREC assessed after 48 h of exposure to different glucose levels (NG = 5.5 mM d-glucose, HG = 25 mM d-glucose) in the presence or absence of TS (5 μM). Values are mean ± SEM for n = 3. * p < 0.01 vs. NG and # p < 0.01 vs. HG.

