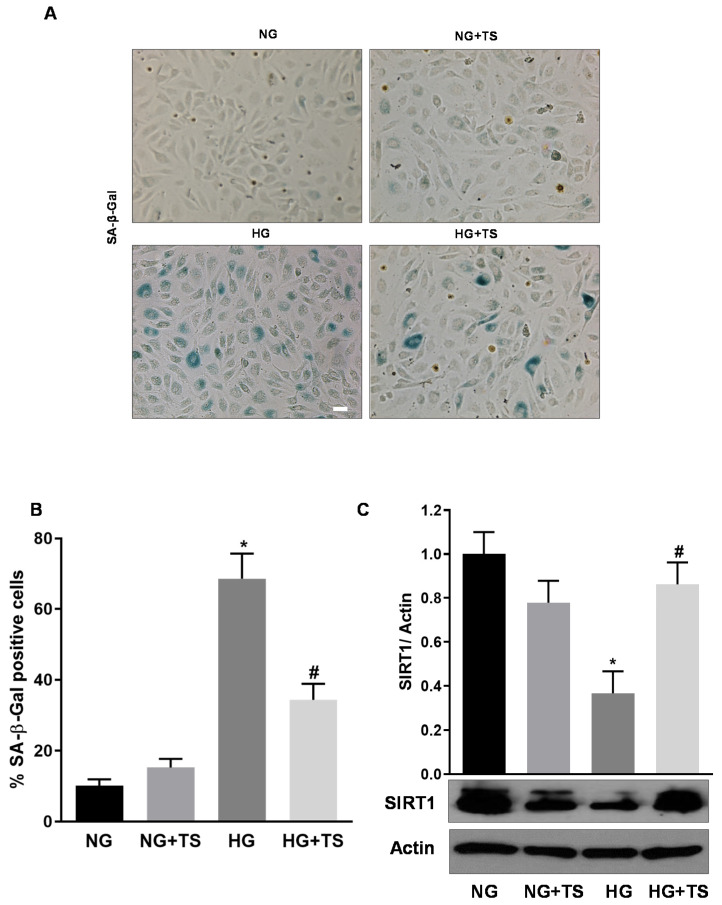
Figure 10.
Tubastatin A effects on HG-induced senescence markers in HuREC. (A) Representative images of senescence-associated β-Galactosidase (SA-β-Gal) reactivity assay in HuREC exposed to HG for 48 h or HG plus 5 µM of TS (HG + TS), also for 48 h, and compared to HuREC cultured in NG conditions in the absence (NG) or presence of 5 µM TS (NG + TS). Positive cells develop the blue color. Scale bar, 50 µm. (B) Quantification of SA-β-Gal-positive cells. Values are number of positive cells per well versus total number of cells expressed as a percent. n = 3. * p < 0.001 vs. NG and # p < 0.001 vs. HG. (C) Western blotting analysis showing protein levels of the histone deacetylase SIRT1 in HuREC treated in the same experimental conditions as described in (A). Bar histograms represent optical density values of the blots normalized for the loading control actin. Values are mean ± SEM for n = 3. * p < 0.01 vs. NG and # p < 0.01 vs. HG.

