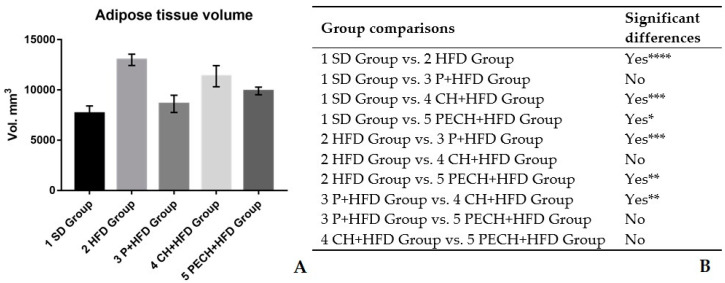
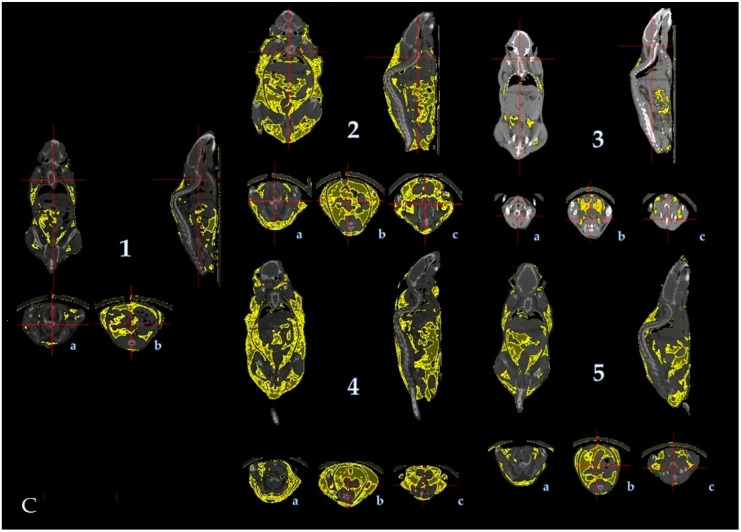
Figure 1.
Effect of the different diets on the adipose tissue volume. (A) Adipose tissue volume expressed as mm3 at the end of the study. Numbers and groups correspond as following: (1) Standard diet, (SD), (2) high-fat diet (HFD), (3) phenolic-enriched high-fat diet (P+HFD), (4) lyophilized cooked ham enriched high-fat diet (CH+HFD) and (5) lyophilized phenolic enriched cooked ham enriched high-fat diet (PECH). (B) Statistical comparison Significant differences are expressed as * p < 0.05 ** p < 0.01 *** p < 0.001 **** p < 0.0001 (C) PET/SPECT/CT computerized images showing areas with a density attributed to adipose tissue coloured by yellow (voxels).


