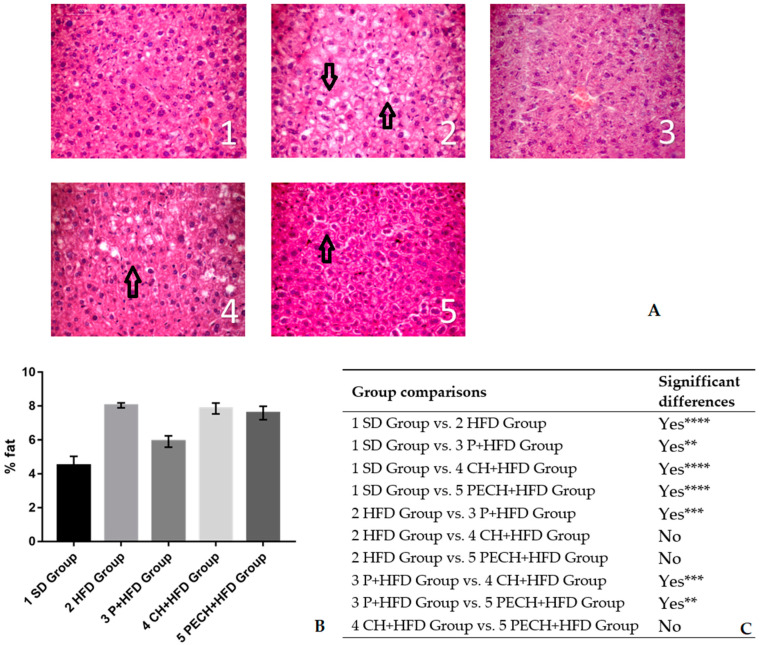
Figure 3.
Effect of the different diets on the fat content in liver. (A) Liver cuts stained with hematoxylin-eosin. Non-stained areas correspond with lipid deposits between hepatocytes, pointed by black arrows. Numbers and groups correspond as following: (1) Standard diet, (SD), (2) high-fat diet (HFD), (3) phenolic-enriched high-fat diet (P + HFD), (4) lyophilized cooked ham enriched high-fat diet (CH + HFD) and (5) lyophilized phenolic enriched cooked ham enriched high-fat diet (PECH). (B) The graph shows total fat content in humid samples as %. (C) Statistical comparison. Significant differences are expressed as ** p < 0.01 *** p < 0.001 **** p < 0.0001.

