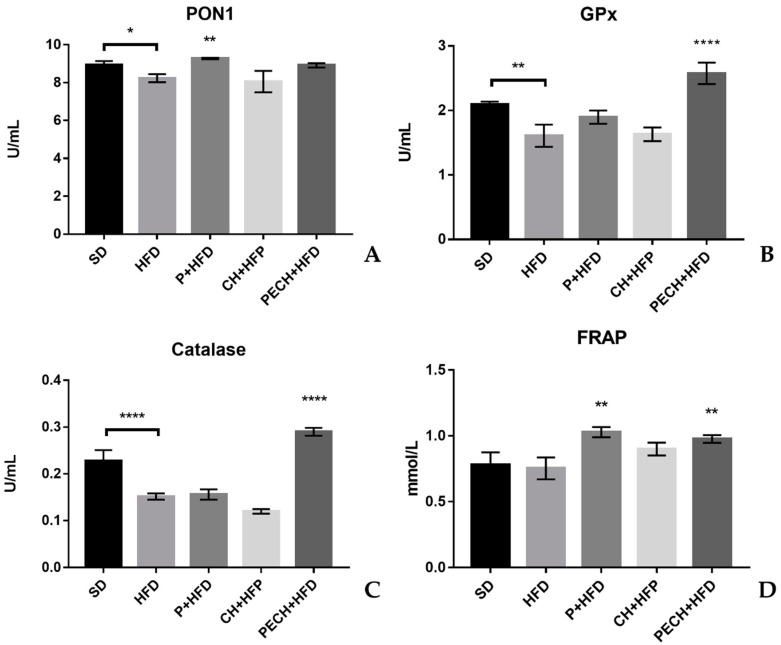
Figure 6.
Effect of the different diets on antioxidant biomarkers. (A) PON1, (B) GPx, (C) Catalase, (D) FRAP. The different diets compared were standard diet, SD, n = 4), high-fat diet (HFD, n = 8), phenolic-enriched high-fat diet (P + HFD, n = 8), lyophilized cooked ham enriched high-fat diet (CH + HFD, n = 8) and lyophilized phenolic enriched cooked ham enriched high-fat diet (PECH + HFD, n = 8). HFD mean results were compared against P + HFD, CH + HFD and PECH + HFD diets, significant differences are expressed as * p < 0.05 ** p < 0.01 **** p < 0.0001. When they exist, differences between SD and HFD were represented with ”∩”.

