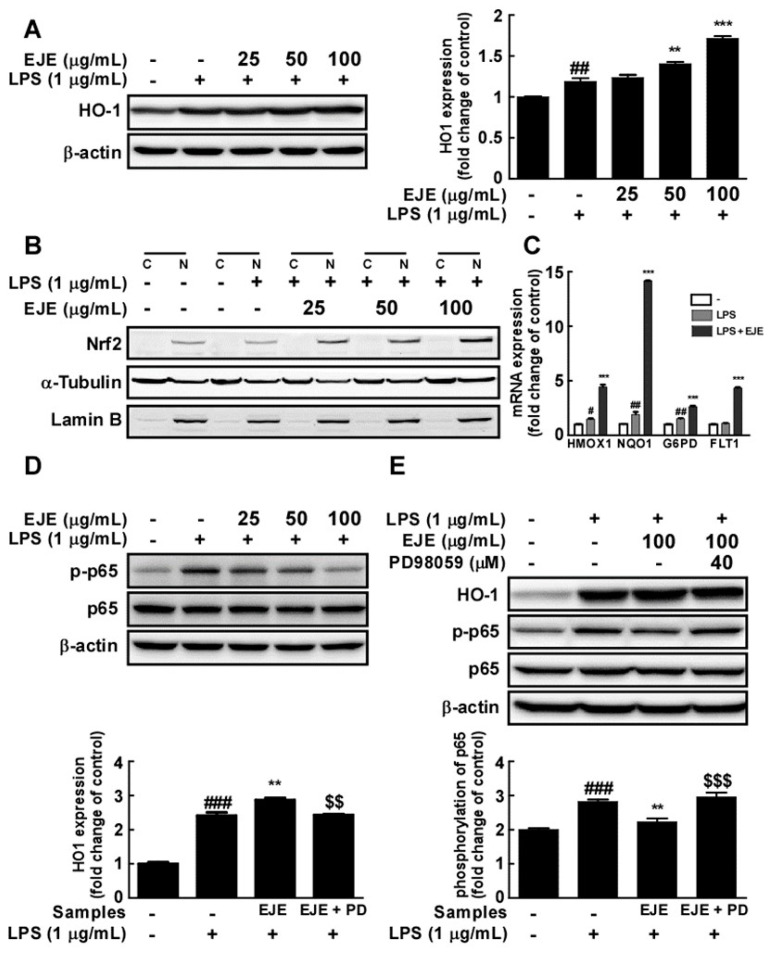
Figure 4.
Effect of EJE on LPS-induced heme oxygenase-1 (HO-1) expression and p65 phosphorylation in BV2 cells. (A) EJE induced HO-1 expression in BV2 cells. HO-1 expression was confirmed by Western blot. (B) EJE induced nuclear factor erythroid 2-related factor 2 Nrf2 expression in the nuclei of BV2 cells. Protein expression was assessed by Western blotting with specific antibodies. (C) EJE increased the expression of Nrf2 target genes, including heme oxygenase-1 (HMOX1), NAD(P)H quinone dehydrogenase-1 (NQO1), glucose-6-phosphate dehydrogenase (G6PD) and fms related receptor tyrosine kinase-1 (FLT1) in BV2 cells. The expression levels of mRNA were quantified by quantitative real-time RT-PCR, as described in Materials and Methods. (D) EJE reduced LPS-induced phosphorylation of p65 at 24 h after LPS treatment. (E) ERK 1/2 inhibition reversed the effects of EJE treatment, such as HO-1 induction and the inhibition of LPS-induced p65 phosphorylation in BV2 cells. HO-1 expression and p65 phosphorylation were assessed by each antibody. Hash symbols (#, ## and ###) indicate a significant difference (p < 0.05, p < 0.01 and p < 0.001 respectively) between the control group and the group exposed to LPS alone; asterisks (** and ***) indicate significant differences (p < 0.01 and p < 0.001 respectively) between the groups co-treated with LPS and EJE and the group exposed to LPS alone; dollar signs ($$ and $$$) indicate significant differences (p < 0.01 and p < 0.001 respectively) between the groups co-treated with LPS and EJE and the group exposed to LPS, EJE, and PD65059. In this and all the following Figures, data are presented as the mean ± SEM of three independent experiments.

