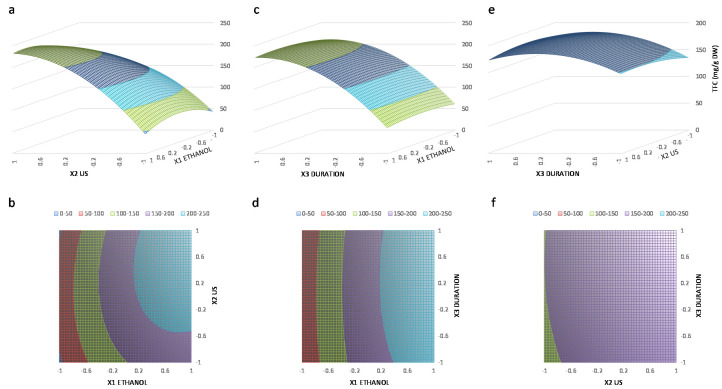
Figure 2.
Three-dimensional (3D) surface response and two-dimensional (2D) contour plots, respectively, from the model predicted TFC (in mg/g DW) extracted from mature N. lotus stamens as a function of aqEtOH concentration and US frequency. (a,b), aqEtOH concentration and extraction duration (c,d) and US frequency and extraction duration (e,f).

