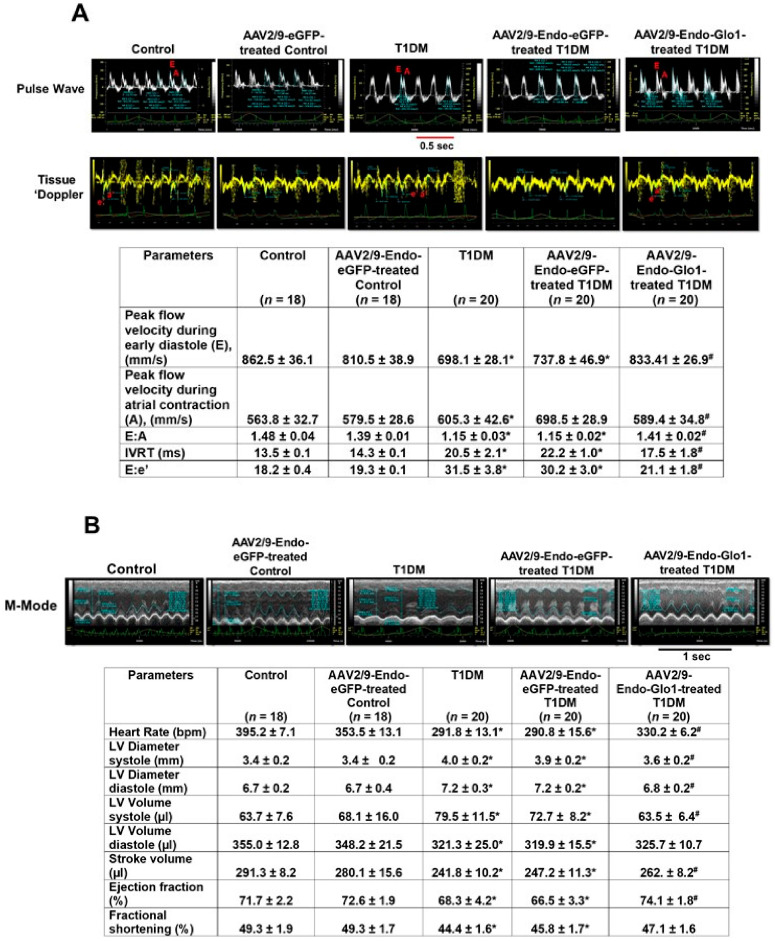
Figure 1.
Original traces showing in vivo cardiac function of hearts from control, T1DM and Table 1. rats. (A) shows representative pulse-wave and tissue Doppler echocardiograms of hearts from control, AAV2/9-Endo-eGFP-treated Con, T1DM, AAV2/9-Endo-eGFP-treated T1DM, and AAV2/9-Endo-Glo1-treated DM rats. The table below shows mean ± S.E.M for peak flow velocity during early diastole (E), peak flow velocity during atrial contraction (A), E: A ratio, IVRT, and E:e’. (B) shows representative M-mode echocardiograms from control, AAV2/9-Endo-eGFP-treated Con, T1DM, AAV2/9-Endo-eGFP-treated T1DM, and AAV2/9-Endo-Glo1-treated DM rats. Hemodynamic data shown in Table below are mean ±S.E.M. Data shown are mean ± SEM. * denote significantly different from control (p < 0.05), # denote significantly different from T1DM (p < 0.05). The number of animals used per group is shown in the tables.

