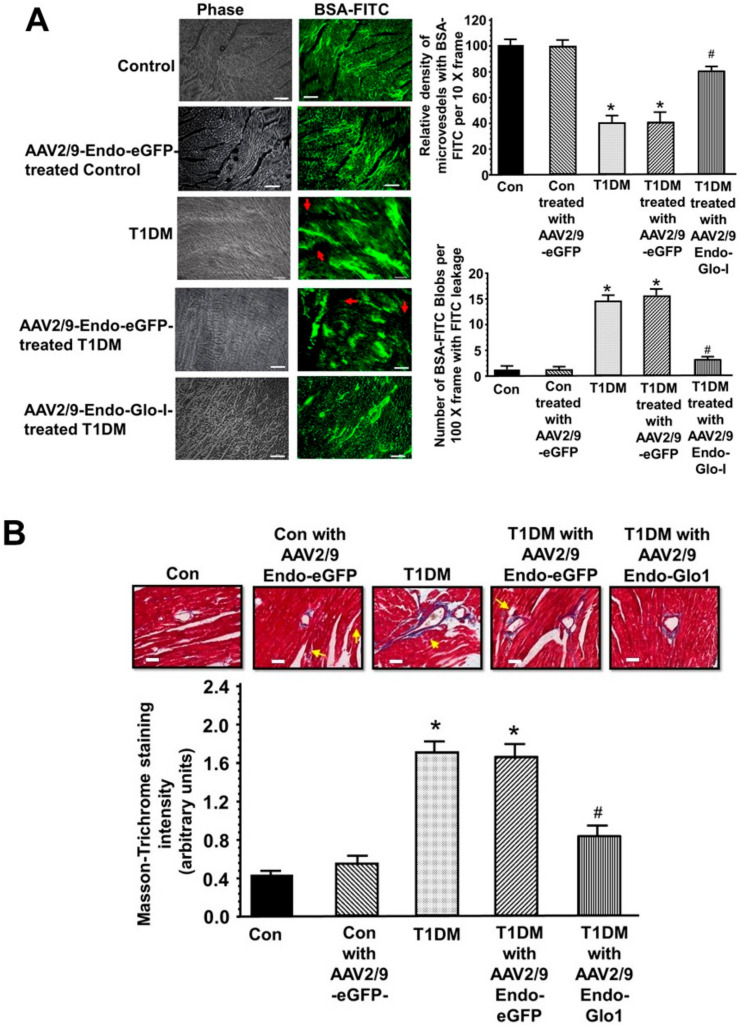
Figure 5.
Vascular perfusion, permeability, and fibrosis in hearts from the control, T1DM, and T1DM-treated rats: (A) shows representative images of BSA-FITC in left ventricular tissues from the control, AAV2/9-Endo-eGFP treated control, T1DM, AAV2/9-Endo-eGFP-treated T1DM, and AAV2/9-Endo-Glo1-treated T1DM rats. Graphs on the upper right show the relative density of BSA-FITC per 10× frame and in the lower left, the relative density of BSA-FITC blobs per 10× frame (an index of vascular leakage). Values are mean ± S.E.M from n > 20 sections from n = 5–6 rats. White bar at bottom of each image = 50 µm. (B), shows representative 10× sections showing Masson Trichrome staining in left ventricular sections (apex) from control, AAV2/9-Endo-eGFP-treated Con, T1DM, AAV2/9-Endo-eGFP-treated T1DM and AAV2/9-Endo-Glo1-treated DM rats. Graph below is mean ± S.E.M from n > 20 sections from n = 4–5 male rats. * denote significantly different from the control (p < 0.05), # denote significantly different from T1DM (p < 0.05). White bar at bottom of each image = 50 µm.

