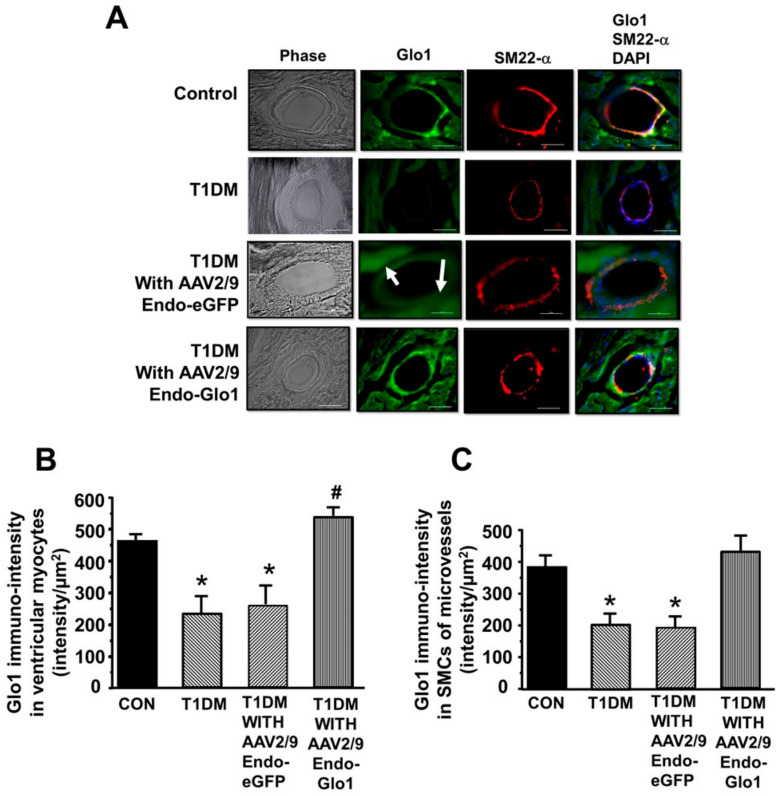
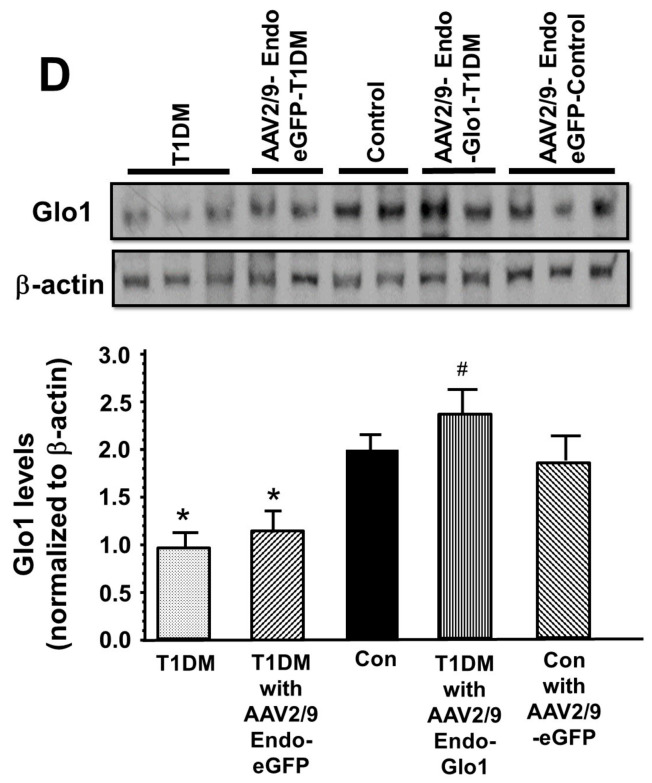
Figure 6.
Glo1 levels in ventricular tissues. (A) shows immuno-fluorescence staining for Glo1 in myocytes and cSMCs from the control, T1DM, AAV2/9-Endo-eGFP-treated T1DM, and AAV2/9-Endo-Glo1-treated DM rats. White arrow emphasizes the diffuse staining associated with eGFP expression. Graphs in (B) and (C) are mean ± S.E.M. for n ≥ 30 sections obtained from N = 4–6 animals per group. (D) shows an autoradiogram for Glo1 protein in hearts from the control, AAV2/9-Endo-eGFP treated control, T1DM, AAV2/9-Endo-eGFP-treated T1DM, and AAV2/9-Endo-Glo1-treated T1DM rats. Graph below are mean ± S.E.M from ventricular homogenates from n = 5 rats done in duplicates. * denote significantly different from the control (p< 0.05), # denote significantly different from T1DM (p < 0.05). Bar at bottom of each image = 50 µm.


