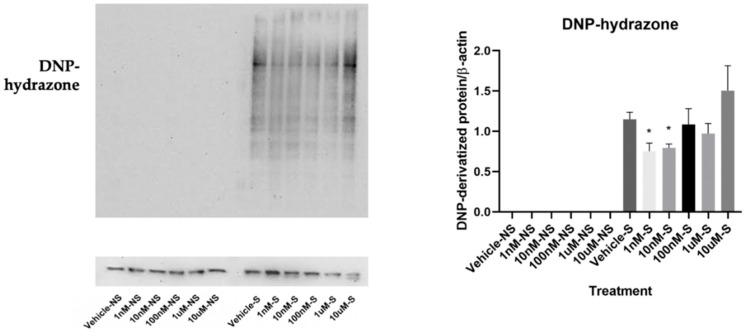
Figure 2.
Effects of lycopene treatment at 1 nM, 10 nM, 100 nM, 1 μM, and 10 μM for 24 h on oxidative stress. Graphic representation of fold changes in the carbonyl groups that were introduced to protein side chains, quantified by using OxyBlot analysis. Three replicates were used for statistical analysis. Values are means ± SEMs. S—cells exposed to smoke; NS—cells not exposed to smoke; * indicates significance at p < 0.05 compared with cells exposed to smoke treated with vehicle.

