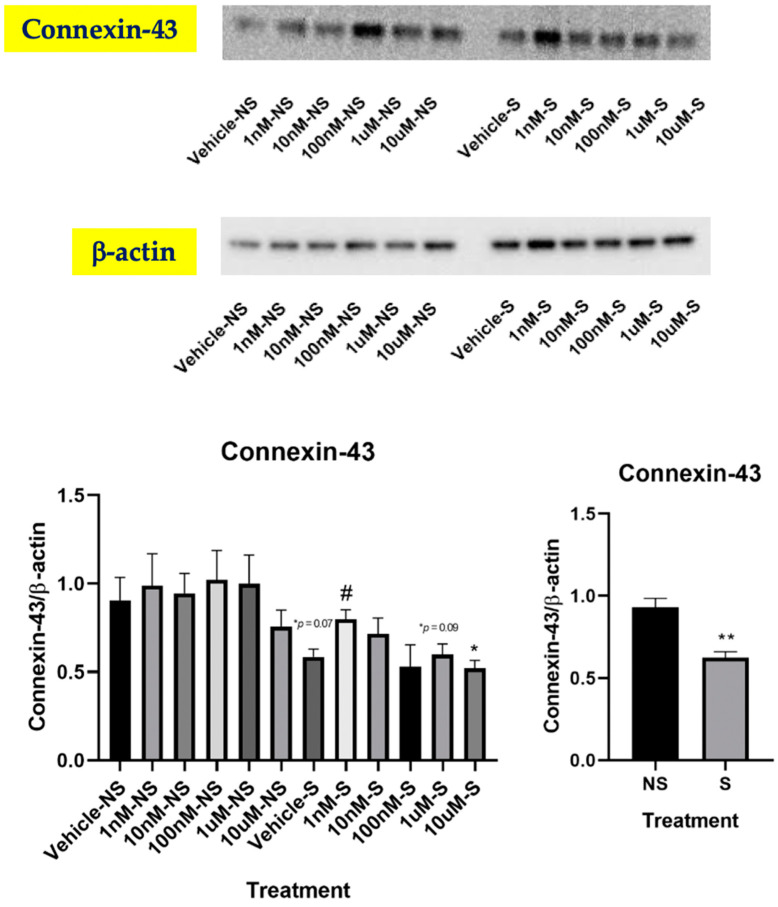
Figure 5.
Effects of lycopene treatment at 1 nM, 10 nM, 100 nM, 1 μM and 10 μM for 24 h on Cx43. Graphic representation of fold changes in the protein expression of Cx43. Three replicates were used for statistical analysis. Values are means ± SEMs. NS—cells not exposed to smoke; S—cells exposed to smoke; cells treated with vehicle. Student’s t test was used to compare protein expressions between lycopene-treated cells and vehicle-treated cells; * indicates significance at p < 0.05 compared with the cells not exposed to smoke treated with vehicle; # indicates significance at p < 0.05 compared with smoking. Two-way ANOVA was used to compare protein expressions between the cells exposed to smoke and the cells not exposed to smoke; ** indicates significance at p < 0.01 compared with the cells not exposed to smoke.

