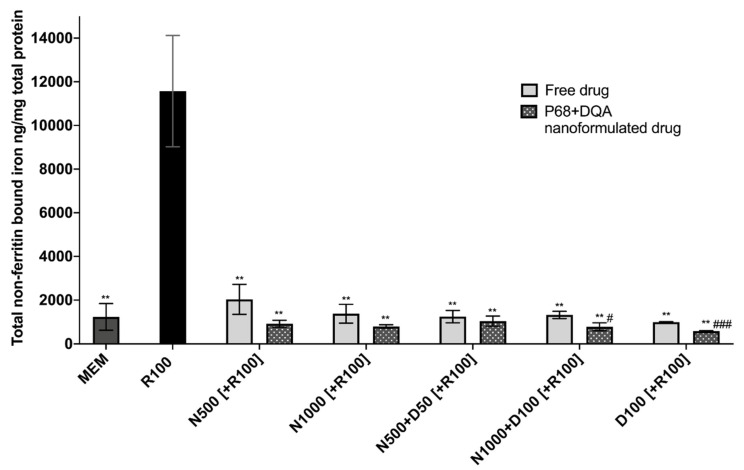
Figure 4.
Total non-ferritin-bound iron concentrations resulting from 3 h pre-treatment with free-drug or P68 + DQA nanoformulated preparations of either 500 and 1000 μM NAC (N500, N1000), combined NAC with 50 or 100μM DFO (N500 + D50, N1000 + D100) or 100 μM DFO alone (D100) followed by 24 h treatment with 100 μM rotenone (R100) compared to R100 treatment alone. MEM represents the control condition where cells were only treated with media, no pre-treatment nor R100 treatment (mean ± S.D., n = 6). Total non-ferritin-bound iron was calculated using the total iron concentrations obtained from the ferrozine assay minus the mean ferritin concentrations obtained from the ferritin ELISA (see Supplementary Figure S2). * represents the significance of control or pre-treatment conditions compared to R100 treatment alone (** p < 0.01). # represents the significance of nanoformulated drug compared to free drug within the same treatment condition (# p < 0.05, ## p < 0.01).

