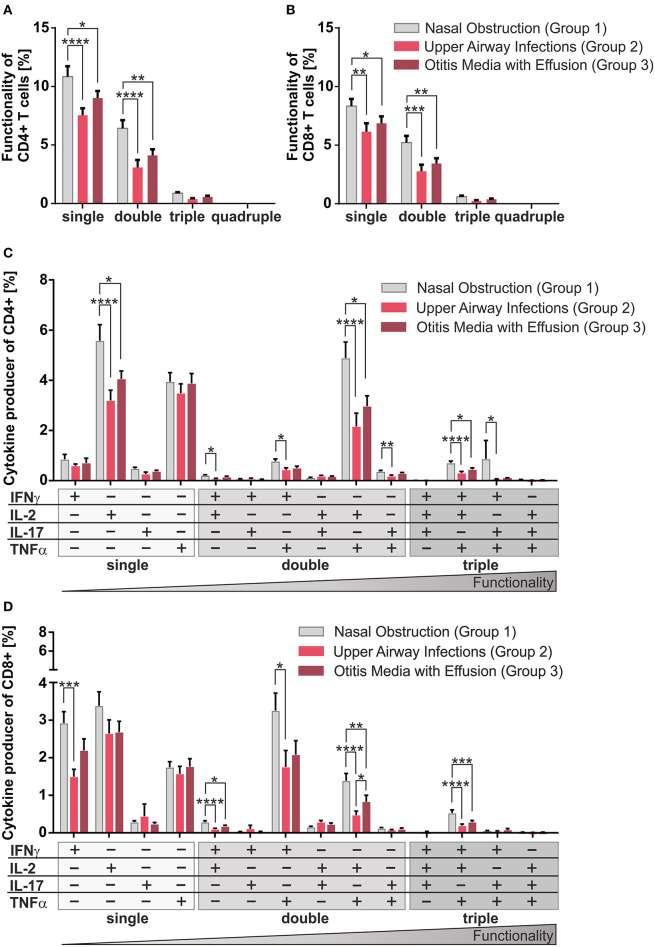
Figure 2.
Multifunctionality of CD4+ and CD8+ T-cells among the three clinical groups. MCs of pediatric adenoids were stimulated as described in Figure 1. Intracellular cytokine expression of CD4+ and CD8+ T-cells was determined by using flow cytometry and the Boolean gating strategy. (A,B) Frequency of summarized CD4+ and CD8+ subpopulations (summarized subsets that express just one (single), or simultaneously two (double), three (triple), or four (quadruple) different cytokines) among all CD4+ (A) and CD8+ (B) T-cells. (C,D) Frequencies of individual CD4+ and CD8+ subpopulations (+ indicates the expressed cytokine) among all CD4+ (C) and CD8+ (D) T-cells. Light gray bars represent children suffering from sole upper airway obstruction (group 1), whereas red bars represent children additionally suffering from recurrent upper airway infections (group 2), and dark red bars stand for children with concomitant otitis media with effusion (group 3). The triangle symbolizes that the functionality of the T-cells increases with the number of cytokines produced simultaneously (two-way ANOVA, Tukey HSD multiple comparisons) *p < 0.05, **p < 0.01, ***p < 0.001, ****p < 0.0001.

