Figure 2.
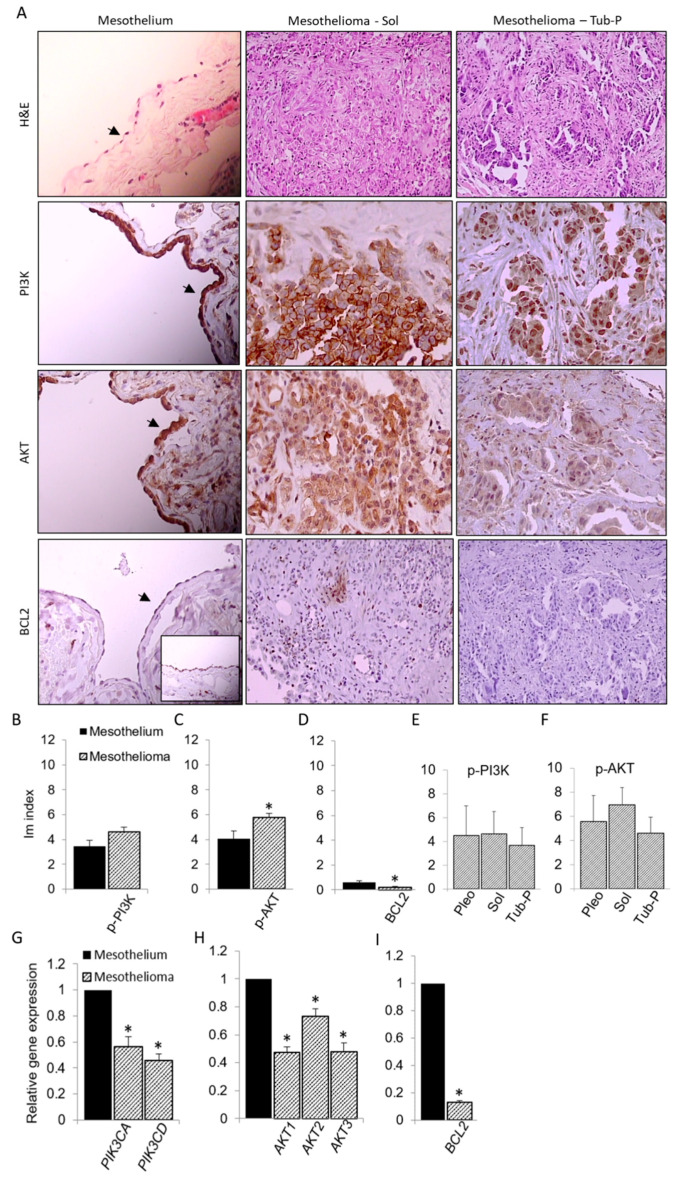
Expression of p-PI3K, p-AKT and BCL2 in mesothelioma. (A) Images represent samples of human normal mesothelium and two histological subtypes of mesothelioma, solid (Sol) and tubulopapillary (Tub-P) analyzed by H&E and immunohistochemical staining. All p-PI3K, p-AKT and mesothelium images are magnified ×400 and arrow marks monolayer of mesothelial cells. Other images are magnified ×200. A smaller mesothelioma BCL2 image shows sample with very high expression of BCL2, which is found only in few samples. (B–D) Summary data of Im index for each protein, representing relative expression of that protein in mesothelium and all mesothelioma samples. (E,F) Comparison of Im index among three subtypes of mesothelioma, pleomorphic (Pleo), Sol and Tub-P. Relative expression of two PI3K (PIK3CA and PIK3CD), three AKT (AKT1, AKT2 and AKT3) and BCL2 gene is summarized in (G–I). Data are means ± SEM; * p < 0.05 vs Mesothelium.

