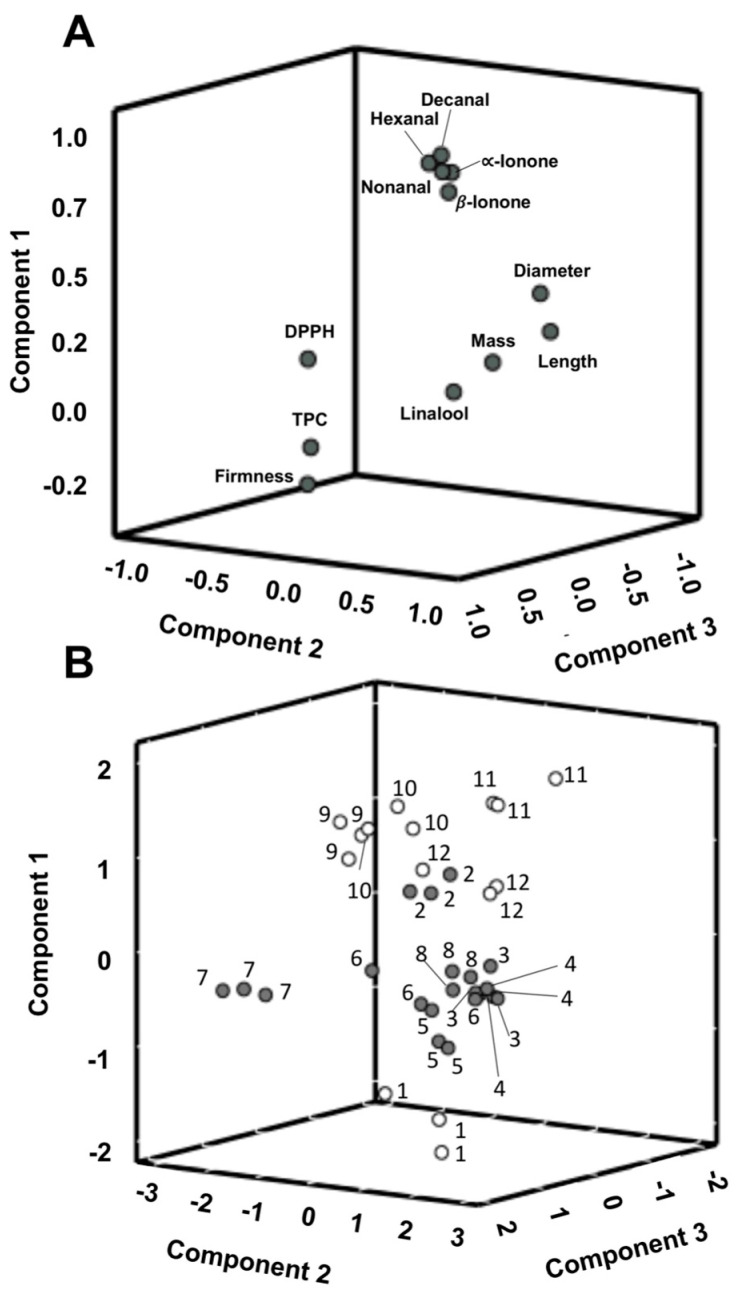
Figure 5.
(A) 3-D projection of parameters onto a Principal Component Analysis (PCA) plot constructed from the principal component analysis of the data; (B) PCA-score plot of samples grouped in Group 1 (•) and Group 2 (°) of the cluster analysis with 1: sample “Adelita” (S1), 2: “P04” (S2), 3: “Lupita” (S3), 4: “Enrosadira” (S4), 5: “P10” (S5), 6: “Quanza” (S6), 7: “Lupita” (S7), 8: “Versalles” (S8), 9: “Adelita” (S9), 10: “Adelita” (S10), 11: “Adelita” (S11) and 12: “Adelita” (S12) and three field replications per raspberry cultivar.

