Figure 4.

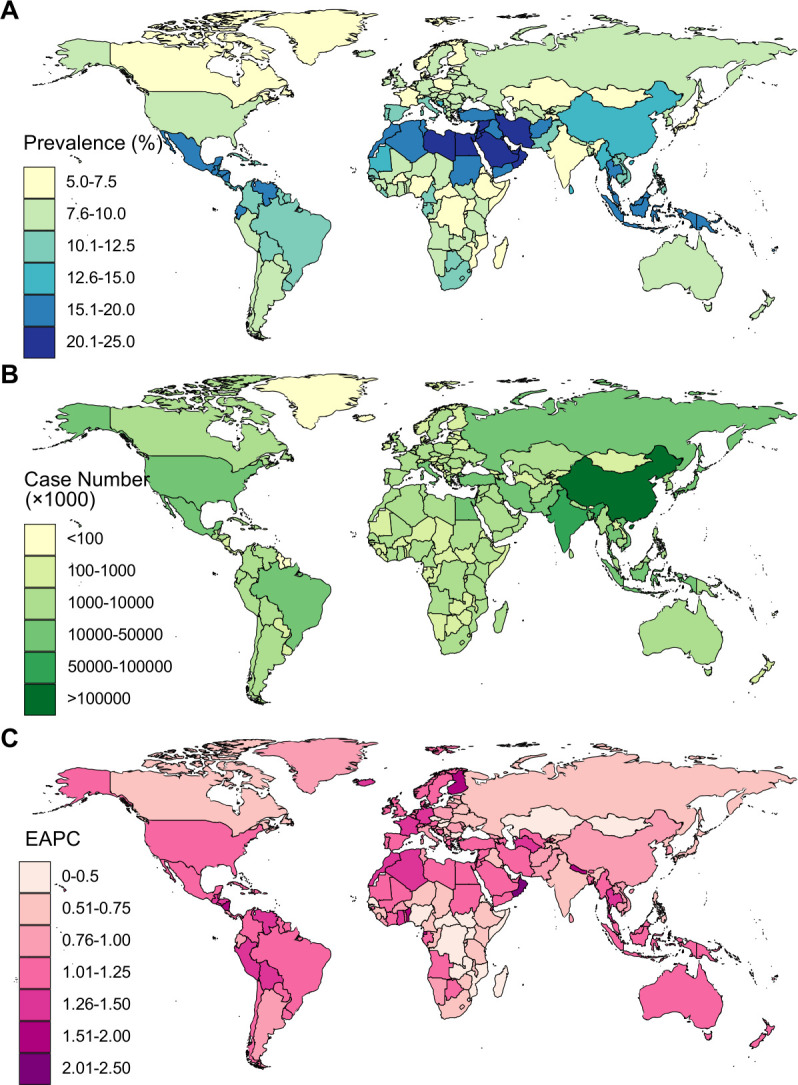
Age-standardised prevalence rates (A), case numbers (B) and trends (C) in non-alcoholic fatty liver disease between 1990 and 2017 at the national level. EAPC, estimated annual percentage change.

Age-standardised prevalence rates (A), case numbers (B) and trends (C) in non-alcoholic fatty liver disease between 1990 and 2017 at the national level. EAPC, estimated annual percentage change.