Abstract
Aicardi Goutières Syndrome (AGS) is a monogenic interferonopathy caused by abnormalities in the intracellular nucleic acid sensing machinery (TRE4X1, RNASEH2A, RNASEH2B, RNASEH2C, SAMHD1, ADAR1, or IFIH1). Most individuals affected by AGS exhibit some degree of neurologic impairment, from spastic paraparesis with relatively preserved cognition to tetraparesis and severe intellectual disability. Because of this heterogeneity, it is important to fully characterize the developmental trajectory in AGS.
To characterize the clinical presentation in AGS, early features were collected from an international cohort of children (n=100) with genetically confirmed AGS. There was a heterogeneous age of onset, with overlapping clusters of presenting symptoms: altered mental status, systemic inflammatory symptoms, and acute neurologic disability. Next, we created genotype-specific developmental milestone acquisition curves. Individuals with microcephaly or TREX1-related AGS secondary were the most severely affected, and less likely to reach milestones, including head control, sitting, and nonspecific mama/dada. Individuals affected by SAMHD1, IFIH1, and ADAR attained the most advanced milestones, with 44% achieved verbal communication and 31% independently ambulated. Retrospective function scales (Gross Motor Function Classification System, Manual Ability Classification Scale, and Communication Function Classification System) demonstrated that two-thirds of the AGS population are severely affected.
Our results suggest multifactorial influences on developmental trajectory, including a strong contribution from genotype. Further studies are needed to identify the additional factors that influence overall outcomes to better counsel families and to design clinical trials with appropriate clinical endpoints.
Keywords: Leukodystrophy, Developmental disability, Genetics, Neurodevelopment, Pediatric
Introduction
Aicardi Goutières Syndrome (AGS) is a rare genetic disorder of excessive interferon (IFN) production resulting in systemic inflammatory injury (1, 2). Genetic abnormalities in the intracellular nucleic acid sensing machinery (TREX1, RNASEH2A, RNASEH2B, RNASEH2C, SAMHD1, ADAR1, and IFIH1) trigger an aberrant IFN response, which results in extensive end organ damage (1, 3–5).While all identified individuals affected by AGS exhibit some degree of neurologic impairment, this can range from mild spastic paraparesis with normal intelligence to tetraparesis and severe cognitive disability. The magnitude of this developmental heterogeneity challenges clinical trial development. While there is a known association between genotype and overall clinical severity (6), there is an unmet need for fully understanding the impact of genotype on developmental trajectory. As we transition into the era of therapeutic options, it is important to characterize the impact of genotype on developmental expectations so that appropriate outcomes can be selected (6).
In this study, a retrospective international cohort of 100 individuals affected by AGS was analyzed for age and symptoms at presentation and a detailed developmental history was obtained. Using developmental milestones, we were able to create genotype-specific developmental trajectories. Future studies are needed to characterize additional variables that influence overall clinical course.
Methods
Patient Ascertainment and Enrollment
A total of 100 individuals from 94 families affected by AGS were recruited through the Myelin Disorders Bioregistry Project (MDBP) (IRB approved), an arm of the Global Leukodystrophy Initiative Clinical Trial Network (GLIA-CTN) at 3 institutions (Children’s Hospital of Philadelphia, Istituto di Ricerca Clinica C. Mondino, and Spedali Civili of Brescia). AGS was defined as documented neurologic disability in the context of a change in an AGS-related gene: TREX1, RNASEH2A, RNASEH2B, RNASEH2C, SAMHD1, ADAR1, or IFIH1 (Supplemental Table).This neurologic disability ranged from isolated spastic paraparesis to profound global developmental delay. Individuals without a known genetic diagnosis or those with insufficient developmental histories were excluded.
Data Extraction and Collection
Demographic information, including age at last evaluation and mortality, was collected (Table 1; Supplemental Table) (7).Date of acquisition of milestones was obtained from parental questionnaires and confirmed with medical record review. Microcephaly was identified in medical records and defined as more than two standard deviations from the mean for head circumference at the time of final data collection. Presenting information was extracted from concurrent medical records wherever feasible to minimize recall bias.
Table 1.
Demographic Information.
| Total N (% of all individuals) | Age at clinical presentation in months | Systemic symptoms at presentation % of genotype | Altered mental status at presentation % of genotype | Neurologic symptoms at presentation % of genotype | Microcephaly N (%) | |
|---|---|---|---|---|---|---|
| All | 100 | 6.9 | 40 | 41 | 49 | 51 (51) |
| TREX1 | 17 (17) | 1 | 37.5 | 56.3 | 43.8 | 13 (81.3) |
| RNASEH2B | 35 (35) | 5.4 | 55.9 | 52.9 | 38.2 | 15 (42.8) |
| RNASEH2A | 5 (5) | 2.7 | 40.0 | 0.0 | 60.0 | 2 (40.0) |
| RNASEH2C | 2 (2) | 0.5 | 100.0 | 100.0 | 0.0 | 2 (100.0) |
| SAMHD1 | 12 (12) | 7 | 41.7 | 50 | 41.7 | 7 (58.3) |
| ADAR | 15 (15) | 11.5 | 28.6 | 21.4 | 71.4 | 7 (46.7) |
| IFIH1 | 14 (14) | 14.6 | 14.3 | 21.4 | 78.6 | 5 (35.7) |
Standard functional scores, the Gross Motor Functional Classification Scale (GMFCS), the Manual Abilities Functional Classification Scale (MACS), and the Communication Function Classification Scale (CFCS), were assigned from medical records as previously described, at the last available clinical encounter (2, 8–11). These scales are composed of 5-levels with ‘I’ representing normal function and ‘V’ representing complete impairment. The Gross Motor Function Classification System (GMFCS) describes motor impairment (11). Children scored as ‘I’ are independently ambulatory without limitations, while children scored as a ‘V’ require full assistance including with head control. The Manual Ability Classification Scale (MACS) helps to score fine motor skills (10), with a ‘I’ representing normal dexterity and ‘V’ representing the requirement for total assistance. The Communication Function Classification System (CFCS) is used to classify communication skills (8). A CFCS score of ‘I’ represents effective communication as both sender and receiver, while a ‘V’ score represents severe impairment even between familiar partners.
Statistical analysis
Developmental milestones were grouped by genotype and compared to the normative data derived from the Denver Developmental Screening Test II (DDST-II) using the p-value log rank test (7). Skill acquisition was binned by percentage of the cohort who had attained a skill at a given age. In order to compare achievement of milestones by genotype, we created Kaplan-Meier curves for acquisition of developmental milestones. We included indicator variables for each genotype group to evaluate the independent effects of genotype.
Age of acquisition of milestones was also plotted, including the age at which percentiles of the population (p10 for 10%, p25 for 25%, etc) had achieved that specific milestone. These data were grouped by genotype and compared to the normative data derived from the Denver Developmental Screening Test II (DDST-II). The 1992 revision of the DDST, the DDST-II, has been validated across many populations of children with developmental disabilities and brain injuries (12). We selected specific items from the DDST-II to represent the range of skills observed in the AGS population.
Results
Cohort features and presentation
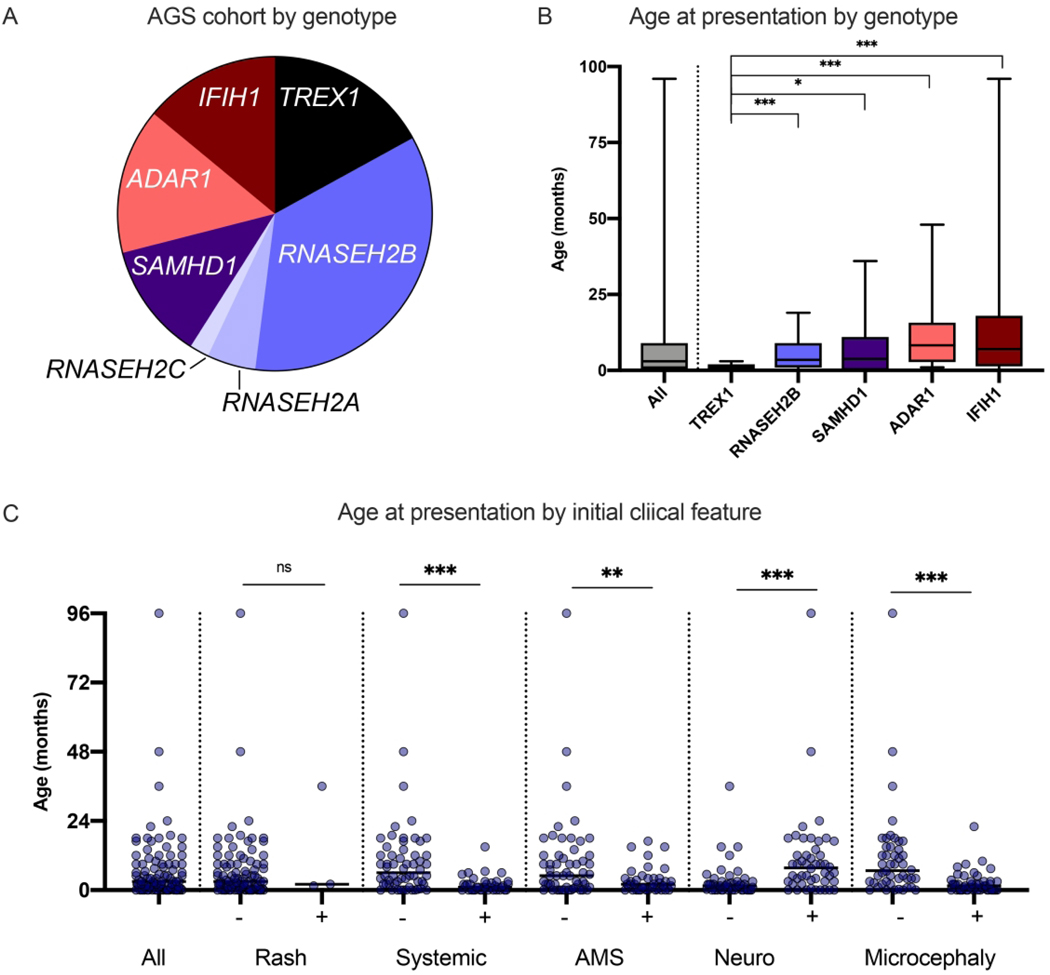
In total, 100 children were included in our international cohort (Table 1). Genotype, symptoms and age at presentation, and developmental milestone acquisition were extracted by retrospective chart review (Figure 1, Supplemental Table). The median age at final milestone collection was 59 months, with a range of 2 months to 34 years. Five individuals are known to be deceased at the time of last data collection, with a range of age at death of 3 months to 9 years. All deceased individuals were from the TREX1 and ADAR1 cohorts. RNASEH2A-related AGS (n=5) and RNASEH2C-related AGS (n=2) had insufficient numbers for inclusion in comparative analyses (Figure 1A).
Figure 1.
Genetics and features at presentation of the US-Italian AGS cohort. A. Genotypic distribution of individuals with AGS across the US and Italian cohorts. B. The age at presentation in months is shown as sorted by genotype. The error bars represent min-max. Individuals with symptoms present at birth were noted as presenting at 0 months. C Features at presentation were classified into non-exclusive categories: neurologic symptoms [Neuro] (e.g. seizures, sudden change in tone, or developmental regression), altered mental status [AMS] (irritability or lethargy), systemic inflammation [Systemic] (e.g. feeding intolerance and fevers), rash [Rash], and Microcephaly. Clinical presentation is shown by age. PvalueswerecalculatedusingMann-Whitneytwo-tailedt-testsand designated as * = < 0.05, ** = < 0.01, and *** = < 0.005.
The age at presentation was calculated by genotype (Figure 1B). Within a genotype, there was notable heterogeneity of features and age at presentation. Children with TREX1-related AGS presented at a young age (average 1.0 months, range birth to 3 months). Children with IFIH1-related AGS had the widest range of age at first clinical symptom: birth to 96 months. Detailed information on presenting symptoms was available for 64 patients. Among all genotypes combined, children with microcephaly had a younger age of onset (mean 2.5 months versus 11.4 months, p<0.001).
The most common presenting features were altered mental status (extreme irritability or lethargy; n=41), feeding intolerance (n=40); and neurologic change (loss of gross motor skills and/or spasticity or dystonia, or seizures; n=49). Additionally, some individuals also presented with manifestations of systemic autoinflammation (e.g. fevers, skin involvement, feeding intolerance, hepatitis) (Figure 1C). Clinical onset was more likely to be characterized by acute neurologic decompensation in ADAR and IFIH1 related AGS (p-value = 0.002 compared to other genotypes while TREX1 and RNASEH2B were more likely to present with altered mental status (p-value = 0.0229). Of note, as children with TREX1-related disease presented at such a young age, it would be difficult to discern neurologic disability at that age. Systemic symptoms at onset were more likely in TREX1 and RNASEH2B versus other genotypes combined (p-value = 0.03; however, the difference between individual genotypes was not statistically significant (p = 0.083).
Children presenting with altered mental status are characterized by a lower age of onset (3.3 months compared to 9.6 months, p-value=0.011).There was not a statistically significant association between the presence of microcephaly and grouped or individual genotypes (p = 0.422 and 0.09, respectively).
Acquisition of developmental milestones
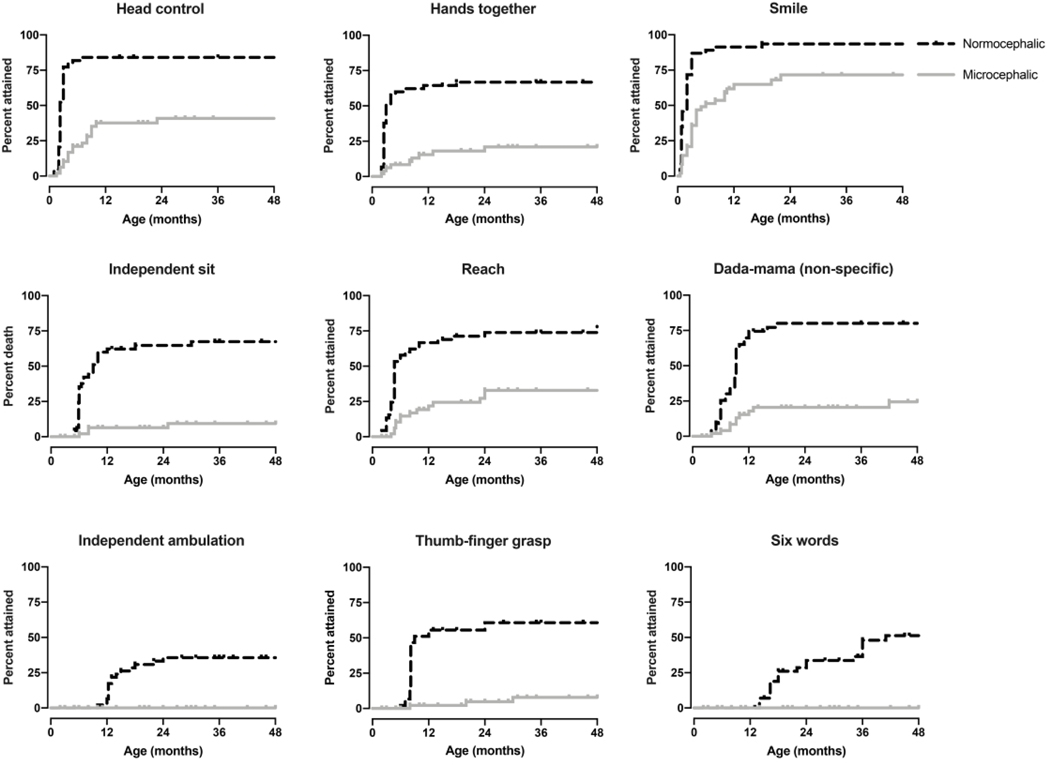
Kaplan-Meier curves characterized the percentage of children that attained a skill at a given age (Figures 2–5). Developmental milestone acquisition correlated with microcephaly, age at presentation, and presenting symptoms. There was a significant correlation between microcephaly and developmental skill achievement (p<0.005) for all assessed milestones (Figure 2).Similarly, earlier age of onset (before 6 and 12 months of age respectively) was associated with significantly worse outcomes regarding developmental milestones acquisition, even when adjusted for genotype in a Cox PH model (log-rank p<0.005, Cox PH p < 0.02 ).Children who presented with altered mental status, characterized as either sustained irritability or lethargy, had significantly decreased early milestone acquisition (p<0.005 except for babbling, p=0.97).
Figure 2.
Developmental milestone acquisition in microcephalic versus nonmicrocephalic individuals. Age at developmental skill acquisition was presented with Kaplan-Meier curves. P-values were calculated using the log-rank (Mantel-Cox) test comparing individuals with microcephaly (>2 standard deviations below the mean head circumference for age) to all other individuals and was <0.005 for all milestones.
Figure 5.
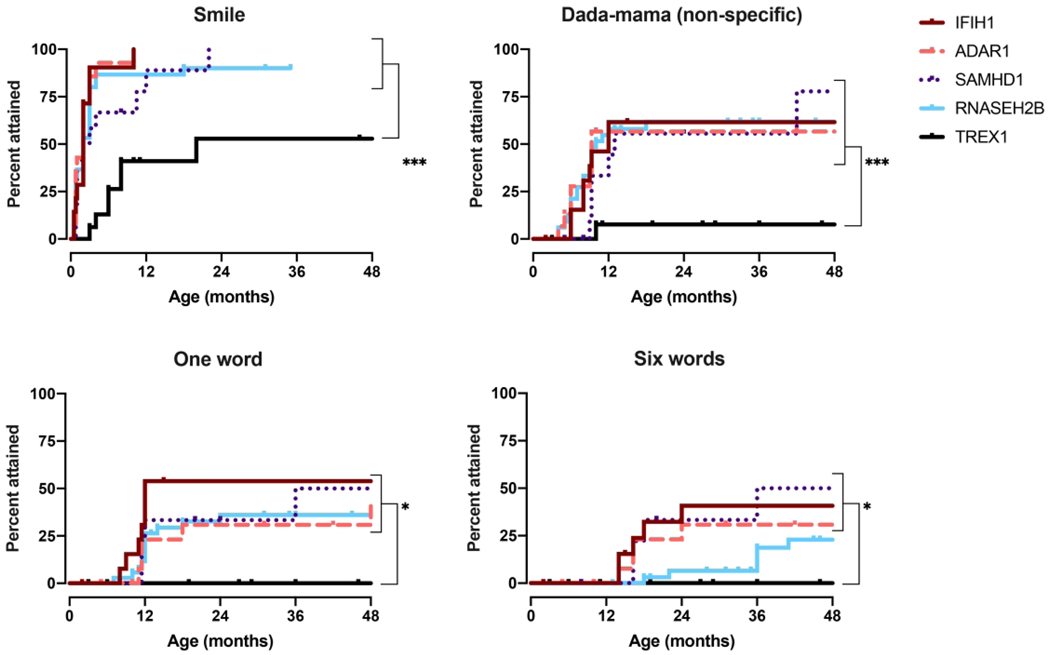
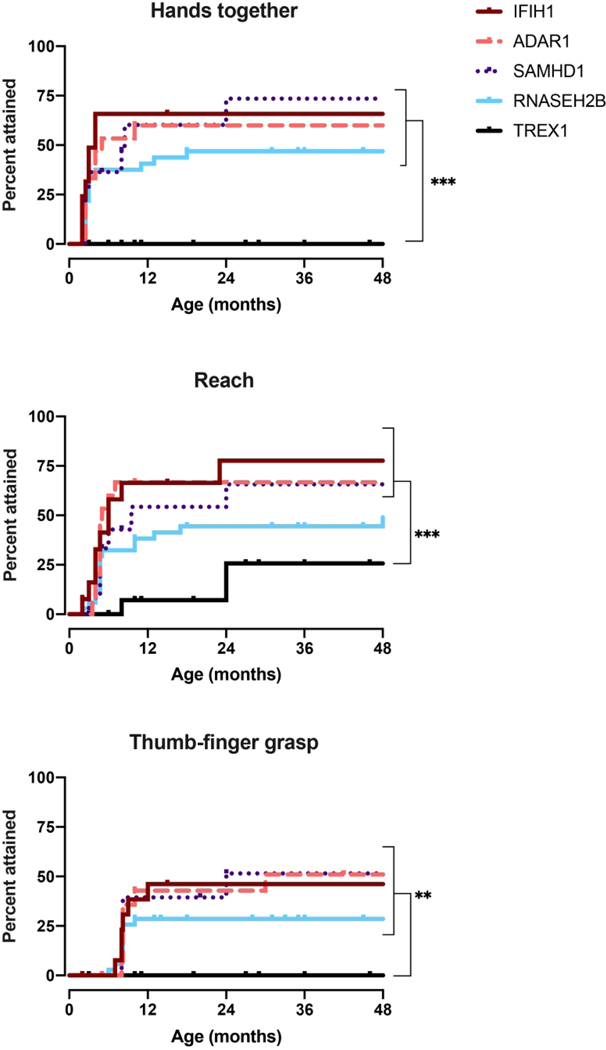
Social and language milestone acquisition by genotype. Age at developmental skillacquisitionwasdeterminedforthe5mostprevalentgenotypes, IFIH1,TREX1, RNASEH2B,SAMHD1, andADAR, as presented with Kaplan-Meiercurves. P-values were calculated using the Log-rank(Mantel-Cox)test comparing genotypes and is designated as * for p<0.05, ** for p < 0.01, and *** for p < 0.005.
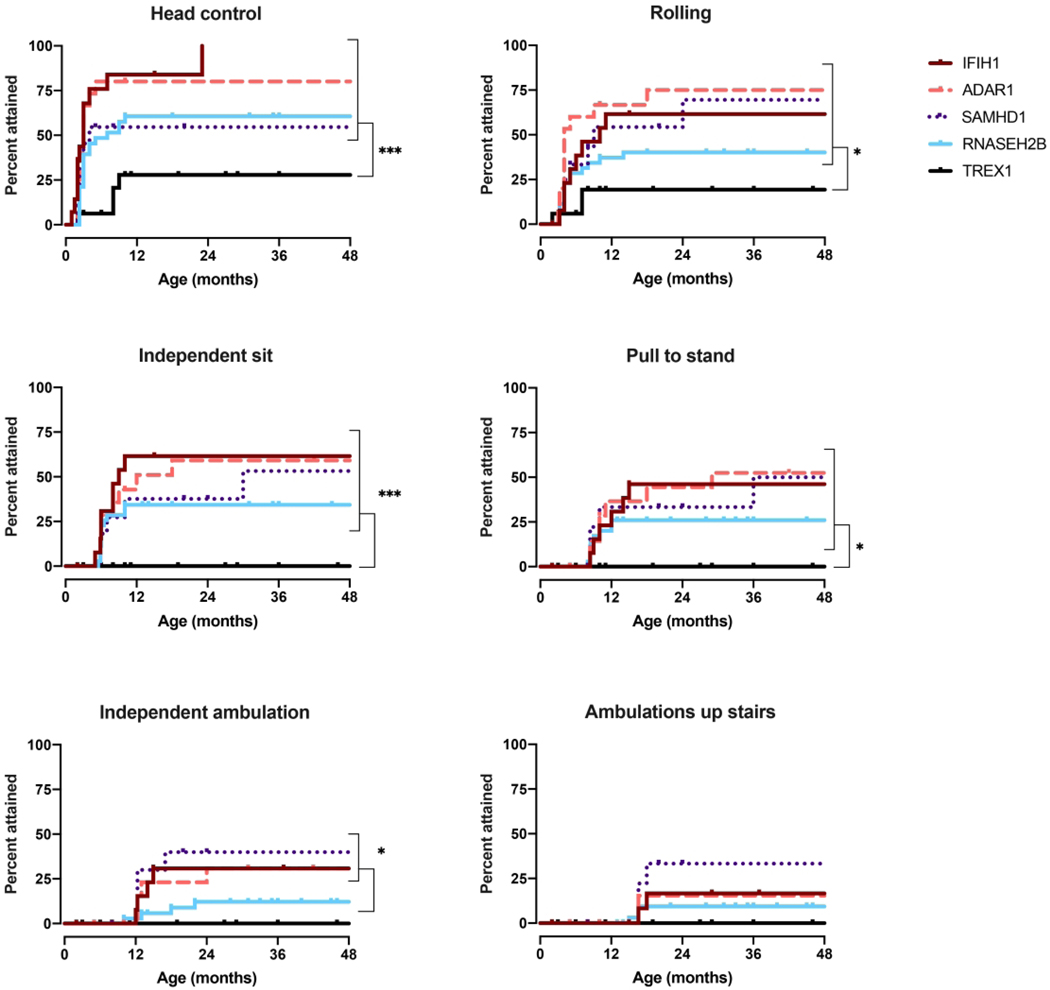
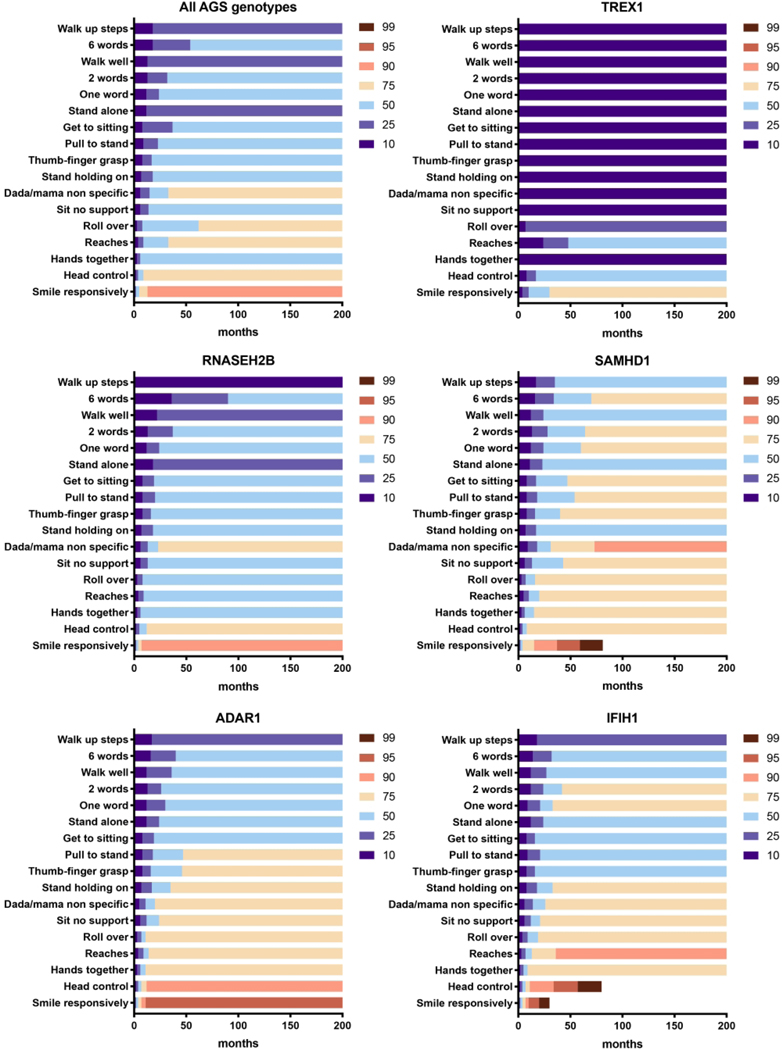
Given limitations in genotype incidence, we were able to perform sub-analysis for only 5 of the genotypes: IFIH1, TREX1, RNASEH2B, SAMHD1, and ADAR (Figure 3–5). Responsive smile was the most attained skill across the entire AGS population (Figure 5).TREX1-related AGS was the most severely affected, and this cohort was statistically distinct from the other AGS-genotypes for most skills including smiling, bringing hands together, achieving head control, babbling, and sitting without support (p <0.005). Children affected by variants in SAMHD1, ADAR, and IFIH1 overall attained the most advanced development. As previously published, individuals with RNASEH2B-related AGS demonstrated a milder neurologic course compared to individuals with TREX1 mutations (2). The developmental trajectory of RNASEH2B-related AGS was compared to the combined cohort of individuals with SAMHD1, IFIH1, and ADAR mutations. These cohorts were distinct in head control (p = 0.032), rolling over (p = 0.044), standing alone (p = 0.043), and walking well (p = 0.033), all of which were less likely to be attained in RNASEH2B-related AGS.To better assess the developmental trajectory as a whole, the age of milestone acquisition was used to create plots of AGS-specific developmental skill acquisition (Figure 6). These provide a visual demonstration of skill acquisition in our AGS cohorts, for example, fewer than 20% of children with TREX1-related AGS achieve rolling over by the age 161 months and fewer than 45% achieve smiling. In SAMHD1-related AGS, individuals are more likely to achieve spoken language (6 words) and independent ambulation than in other genotypes.
Figure 3.
Gross motor milestone acquisition by genotype. Age at developmental skill acquisition was determined for the 5most prevalent genotypes, IFIH1, TREX1, RNASEH2B, SAMHD1, andADAR, as represented with Kaplan-Meier curves. P-values were calculated using the Log-rank(Mantel-Cox)test comparing genotype sand is designated as * for p<0.05, ** for p < 0.01, and *** for p < 0.005.
Figure 6.
Developmental skill acquisition plots were created for the overall AGS population and for the 5 most common genotypes, TREX1, RNASEH2B, SAMHD1, ADAR, and IFIH1. The designation of ‘10’ represents less than 10% of the population has acquired a milestone by the age indicated on the x-axis, while the designation of ‘90’ represents that up to 90% of the population has acquired the skill by the given age. The color-coded heat map indicates the percentage of the population who has attained the milestone at a given age, as shown on the x-axis.
Functional assessment scales
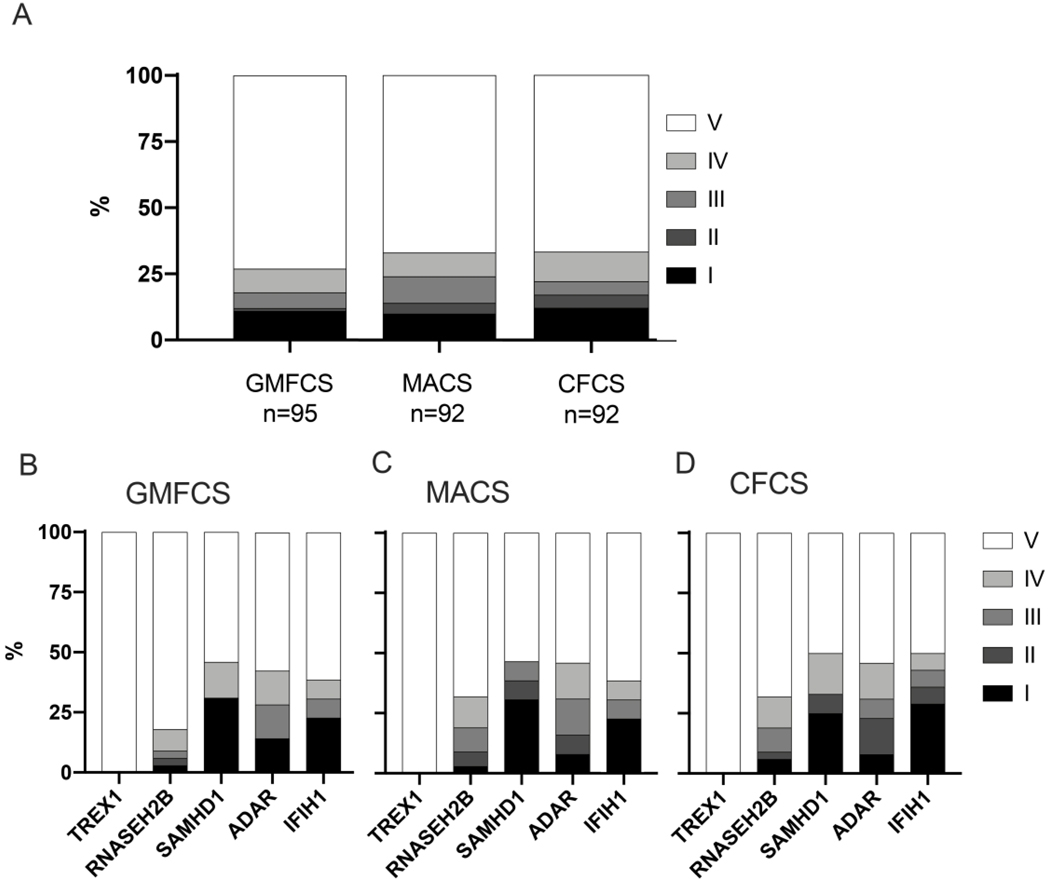
Finally, we applied retrospective functional assessment scales (GMFCS, MACS and CFCS) to the last available clinical encounter (Figures 7A and 7B).All but one child affected by TREX1 scored a ‘V’ on the GMFCS, MACS, and CFCS scales. The other genotypes, IFIH1, RNASEH2B, SAMHD1, and ADAR, demonstrated significant functional diversity, with both mildly and severely impaired individuals within each genotype.
Figure 7.
A.Overall performance by retrospective functional assessment scales in the AGS population. The Gross Motor Function Classification System (GMFCS) describes motor impairment (‘I’ = independently ambulatory without limitations, ‘V’ = full assistance including with head control). The Manual Ability Classification Scale (MACS) helps to score fine motor skills (‘I’ = normal dexterity, ‘V’ = requirement for total assistance with manual tasks). The Communication Function Classification System (CFCS) is used to classify communication skills (‘I’ = effective communication as both sender and receiver, ‘V’ = severe impairment even between familiar partners).B-D. Performance by retrospective functional assessment scales in the AGS population by genotype.
Conclusions
AGS is a genetically heterogeneous disorder caused by changes within the nucleic acid sensing machinery, resulting in sustained interferon production. While all children described to date with AGS demonstrate some degree of neurologic impairment, we confirm that the presentation and degree of disability is highly variable (Figures 2–7). This study contributes detailed developmental information to collective published works related to the neurologic features of AGS (2, 6, 13–15). In particular, the current work builds upon our understanding of overall neurologic outcomes in AGS through detailed developmental history analyses (6). As we move towards therapeutic development in AGS and clinical trial design, it is increasingly important to establish a deeper understanding of the neurologic trajectory of AGS.
To this end, we characterized the features of presentation and the overall developmental skill acquisition across the AGS genetic spectrum.As anticipated, we found that children across all genotypes had variable age of onset and presenting symptoms (Figure 1). This underscores one difficulty with early recognition and diagnosis of AGS as the presentation can be heterogeneous. Additionally, the ascertainment of presenting features is complicated by parental recall bias. Many children had delayed development prior to an AGS-specific clinical presentation, as previously described (6). We hypothesize that this pre-presentation period is a key window for potential future therapeutic interventions.
While this study supports genotype as a significant variable affecting neurologic outcomes in AGS, significant intra-genetic cohort variability (Figure 7) suggests the importance of other unidentified factors that may influence the age of presentation and overall outcome. We hypothesize that additional confounding variables may include environmental exposures (such as illnesses) and complementary genetic polymorphisms within the IFN pathway. The difficulty in accounting for these variables is a limitation of the current study.
As most individuals with AGS are currently identified because of a prominent CNS involvement, this study may overestimate severity of neurologic dysfunction of the ultimate population. Additionally, as part of the Global Leukodystrophy Initiative Clinical Trial Network across 3 child neurology divisions, our population is biased to include children with severe neurologic impairment. Given the variable involvement of other organ systems in AGS, it is possible that individuals with the same genotypes, but without CNS injury, have not been yet identified. For example, no individuals affected by Familial Chilblain Lupus from TREX1 mutations were included in this cohort. This underscores the need for a better appreciation of the breadth of disease associated with AGS-related genes.
As an example of recruitment bias, we hypothesize that the differences in the developmental skill acquisition in the Italian versus the US cohorts may be due differences in ascertainment by diagnostics strategies. In Italy, the primary diagnostic method is targeted mutation or gene panel analysis, and the children selected for testing are typically “classic” severe presentations with microcephaly and/or intracranial calcifications. In the US, an increasing number of individuals are ascertained by whole exome sequencing for more non-specific symptoms. A more agnostic approach to genetic diagnosis leads to an expansion of phenotypes of AGS.
Overall, children with AGS reached milestones in the same linear developmental course as neurotypical children. Interestingly, there was a small cohort of children who were able to attain new skills for years beyond the expected age of acquisition (Figure 2–5). In our study, we identified 3 distinct cohorts: mild, intermediate, and severe impairment. The mild involvement category included children who were either walking independently or with assistive devices, or had normal speech with some floor mobility. Intermediate category patients have floor mobility through rolling, and some communication skills (includes babbling and language). Severe patients have no mobility, poor head control, and no communication beyond a social smile. These groups clustered by genotype, although genotype alone was not sufficient to predict the course in an individual patient. Individuals with AGS related to SAMHD1, IFIH1, and ADAR mutations achieve a greater number of developmental milestones compared to individual with TREX1-related AGS. TREX1-related AGS was statistically distinct from the other genotypes for most milestone acquisitions, and the RNASEH2B was similar to the milder cohort except for early fine motor function (bringing hands together and reaching), rolling over, and the acquisition of 6 words. Notably, individuals with RNASEH2A and RNASEH2C were not able to be included in these analyses due to low rates of enrollment and overall prevalence. This study is also limited in that it was retrospective and thus the results from functional outcome tools were largely unavailable.
From this study, we have a deeper understanding of the kinetics of development of children with AGS. This study also illustrates potential challenges in clinical trials in the AGS population. As the developmental trajectory of AGS is heterogeneous, it may be challenging to demonstrate clinical efficacy of any future interventions across a mixed population requiring careful consideration of variables including microcephaly, age of onset and genotype. Additionally, in individuals with the severe developmental phenotype, traditional measures of motor and cognitive performance may have significant floor effects. Future clinical studies may benefit from the creation of an AGS-specific scale, similar to what has been developed in other rare diseases (16, 17). Identifiable variables that may affect long-term outcome, such as age of onset, presenting symptoms, genotype, and microcephaly, should be considered in the design of future clinical trials with the selection of appropriate clinical endpoints. In this study, we began to explore the association between genotype and phenotype in this unique disorder. Future studies are needed to validate our findings and further understand AGS-genotype specific subpopulations.
Supplementary Material
Figure 4.
Fine motor milestone acquisition by genotype. Age at developmental skill acquisition was determined for the 5 most prevalent genotypes, IFIH1, TREX1, RNASEH2B, SAMHD1, andADAR, as presented with Kaplan-Meiercurves. P-values were calculated using the Log-rank(Mantel-Cox)test comparing genotypes and is designated as * for p<0.05, ** for p < 0.01, and *** for p < 0.005.
Works Cited
- 1.Crow YJ. Aicardi-Goutieres syndrome. Handbook of clinical neurology. 2013;113:1629–35. [DOI] [PubMed] [Google Scholar]
- 2.Rice G, Patrick T, Parmar R, Taylor CF, Aeby A, Aicardi J, et al. Clinical and molecular phenotype of Aicardi-Goutieres syndrome. American journal of human genetics. 2007;81(4):713–25. [DOI] [PMC free article] [PubMed] [Google Scholar]
- 3.Livingston JH, Crow YJ. Neurologic Phenotypes Associated with Mutations in TREX1, RNASEH2A, RNASEH2B, RNASEH2C, SAMHD1, ADAR1, and IFIH1: Aicardi-Goutieres Syndrome and Beyond. Neuropediatrics. 2016;47(6):355–60. [DOI] [PubMed] [Google Scholar]
- 4.Rice GI, Bond J, Asipu A, Brunette RL, Manfield IW, Carr IM, et al. Mutations involved in Aicardi-Goutieres syndrome implicate SAMHD1 as regulator of the innate immune response. Nature genetics. 2009;41(7):829–32. [DOI] [PMC free article] [PubMed] [Google Scholar]
- 5.Adang LA, Frank DB, Gilani A, Takanohashi A, Ulrick N, Collins A, et al. Aicardi goutieres syndrome is associated with pulmonary hypertension. Molecular genetics and metabolism. 2018. [DOI] [PMC free article] [PubMed] [Google Scholar]
- 6.Crow YJ, Chase DS, Lowenstein Schmidt J, Szynkiewicz M, Forte GM, Gornall HL, et al. Characterization of human disease phenotypes associated with mutations in TREX1, RNASEH2A, RNASEH2B, RNASEH2C, SAMHD1, ADAR, and IFIH1. American journal of medical genetics Part A. 2015;167a(2):296–312. [DOI] [PMC free article] [PubMed] [Google Scholar]
- 7.Frankenburg WK. Denver II. Denver, CO : Denver Developmental Materials, [1990] ©1990; 1990. [Google Scholar]
- 8.Palisano RJ, Avery L, Gorter JW, Galuppi B, McCoy SW. Stability of the Gross Motor Function Classification System, Manual Ability Classification System, and Communication Function Classification System. Developmental medicine and child neurology. 2018;60(10):1026–32. [DOI] [PubMed] [Google Scholar]
- 9.Paulson A, Vargus-Adams J. Overview of Four Functional Classification Systems Commonly Used in Cerebral Palsy. Children (Basel, Switzerland). 2017;4(4). [DOI] [PMC free article] [PubMed] [Google Scholar]
- 10.Eliasson AC, Krumlinde-Sundholm L, Rosblad B, Beckung E, Arner M, Ohrvall AM, et al. The Manual Ability Classification System (MACS) for children with cerebral palsy: scale development and evidence of validity and reliability. Developmental medicine and child neurology. 2006;48(7):549–54. [DOI] [PubMed] [Google Scholar]
- 11.Wood E, Rosenbaum P. The gross motor function classification system for cerebral palsy: a study of reliability and stability over time. Developmental medicine and child neurology. 2000;42(5):292–6. [DOI] [PubMed] [Google Scholar]
- 12.Jeong SU, Kim GC, Jeong HJ, Kim DK, Hong YR, Kim HD, et al. The Validity of the Bayley-III and DDST-II in Preterm Infants With Neurodevelopmental Impairment: A Pilot Study. Annals of rehabilitation medicine. 2017;41(5):851–7. [DOI] [PMC free article] [PubMed] [Google Scholar]
- 13.Rice GI, Del Toro Duany Y, Jenkinson EM, Forte GM, Anderson BH, Ariaudo G, et al. Gain-of-function mutations in IFIH1 cause a spectrum of human disease phenotypes associated with upregulated type I interferon signaling. Nature genetics. 2014;46(5):503–9. [DOI] [PMC free article] [PubMed] [Google Scholar]
- 14.Rice GI, Kitabayashi N, Barth M, Briggs TA, Burton ACE, Carpanelli ML, et al. Genetic, Phenotypic, and Interferon Biomarker Status in ADAR1-Related Neurological Disease. Neuropediatrics. 2017;48(3):166–84. [DOI] [PMC free article] [PubMed] [Google Scholar]
- 15.Rice GI, Rodero MP, Crow YJ. Human disease phenotypes associated with mutations in TREX1. Journal of clinical immunology. 2015;35(3):235–43. [DOI] [PubMed] [Google Scholar]
- 16.Ramsey D, Scoto M, Mayhew A, Main M, Mazzone ES, Montes J, et al. Revised Hammersmith Scale for spinal muscular atrophy: A SMA specific clinical outcome assessment tool. PloS one. 2017;12(2):e0172346. [DOI] [PMC free article] [PubMed] [Google Scholar]
- 17.Kehrer C, Blumenstock G, Raabe C, Krageloh-Mann I. Development and reliability of a classification system for gross motor function in children with metachromatic leucodystrophy. Developmental medicine and child neurology. 2011;53(2):156–60. [DOI] [PubMed] [Google Scholar]
Associated Data
This section collects any data citations, data availability statements, or supplementary materials included in this article.


