Fig. 1.

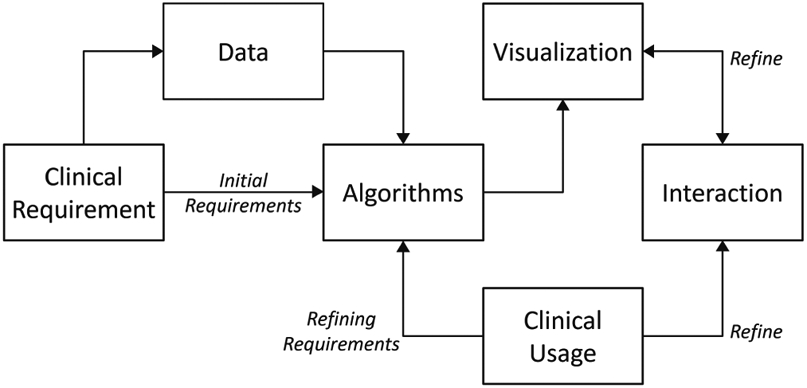
Data flow diagram for tool development planning. Addition of a GUI tremendously increases the usability of the algorithm. Feedback from clinical usage is used to refine the algorithm and rendering further.

Data flow diagram for tool development planning. Addition of a GUI tremendously increases the usability of the algorithm. Feedback from clinical usage is used to refine the algorithm and rendering further.