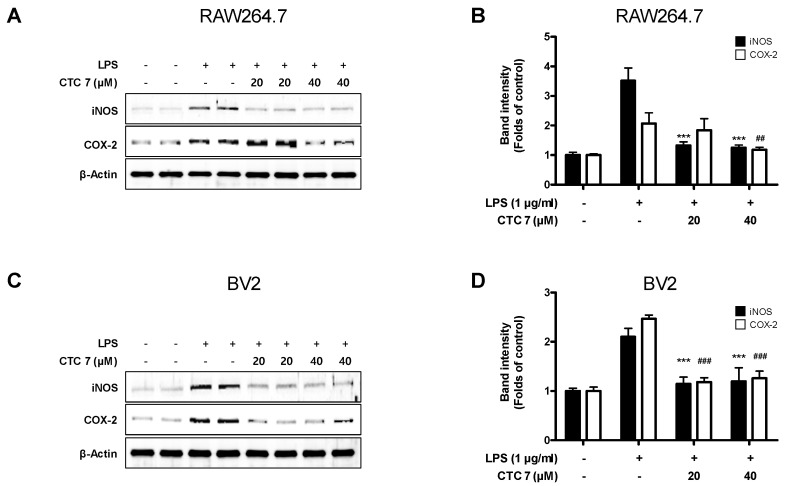
Figure 8.
Effects of CTC 7 treatment on the protein expression levels of iNOS (A) and COX-2 (B) in LPS-stimulated RAW264.7 and BV2 cells. Cells were pretreated for 3 h with the indicated concentrations of CTC 7 and stimulated for 24 h with LPS (1 μg/mL). Western blot analysis was performed as described in the Materials and Methods. Immunoblotting was performed using ImageJ software. Band intensities were normalized to that of β-actin. *** p < 0.001, ## p < 0.01, ### p < 0.001 when compared with the LPS-treated control.

