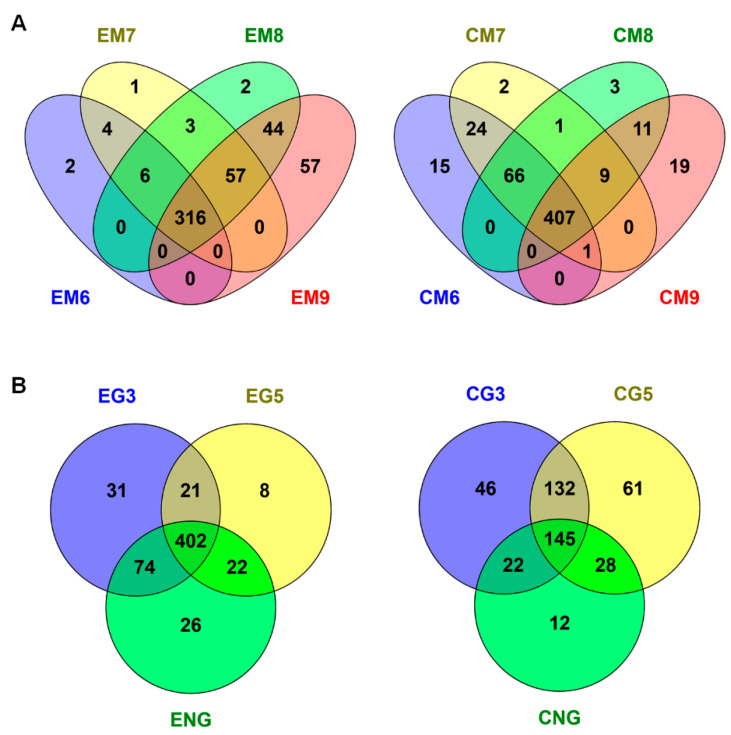
Figure 3.
Venn diagrams represent the number of protein spots generated from the 2-DE analyses in cotyledon and embryonic axis during maturation (A): from M6 to M9, and during germination (B): G3 and G5. The diagrams were plotted using Venny software. The overlapping region between any two groups represents the number of common protein spots between development stages and/or tissues. C: cotyledon; E: embryo; M: maturation; G: germination.

