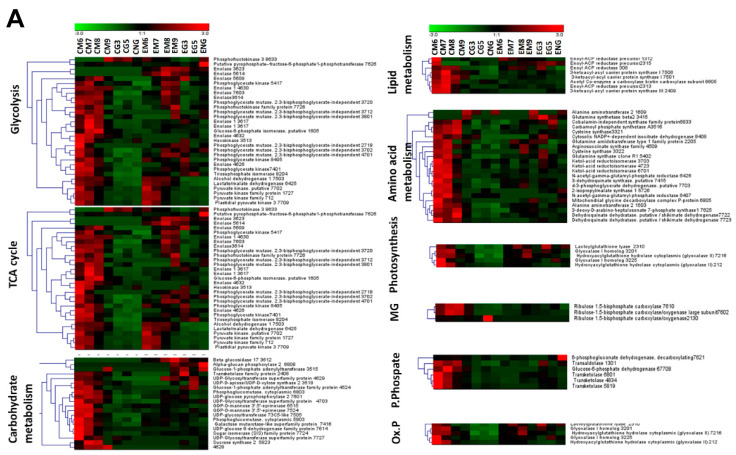
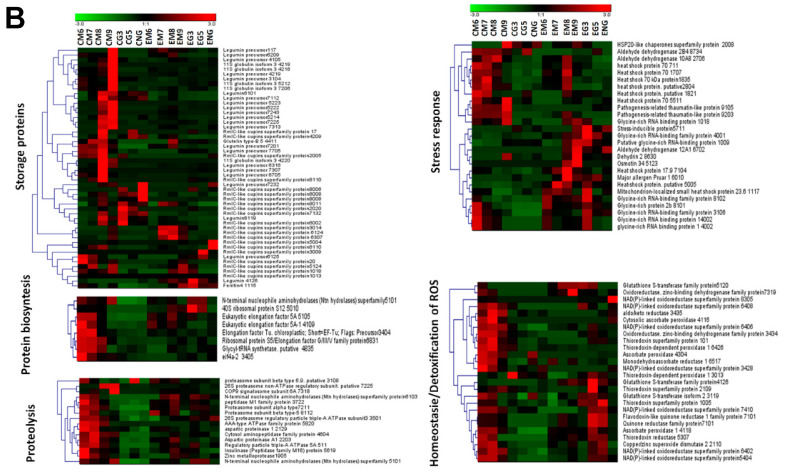
Figure 5.
(A,B) Two-way hierarchical cluster of differentially variable proteins showing changes in abundance in cotyledon and embryo axis along the maturation and germination processes according to the Genesis software package (Eisen et al. 1998). A heatmap representation of the clustered spots shows the protein values according to the level of normalized experiments, which are indicated from −3 (minimum positive expression: clear color) to 3 (maximum positive expression: dark color); black indicates zero expression. Proteins were classified according to the Kyoto Encyclopedia of Genes and Genomes (KEGG).


