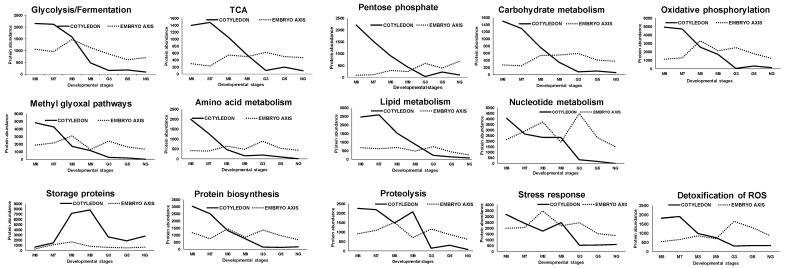
Figure 6.
Time course trends of the different protein groups along the maturation and germination stages. Values correspond to the mean abundance of all the proteins within each group (see Figure 5 and Table S6). Data from non-germinating, unviable seeds have been also included. Black line: cotyledon; point rond line: embryo axis.

