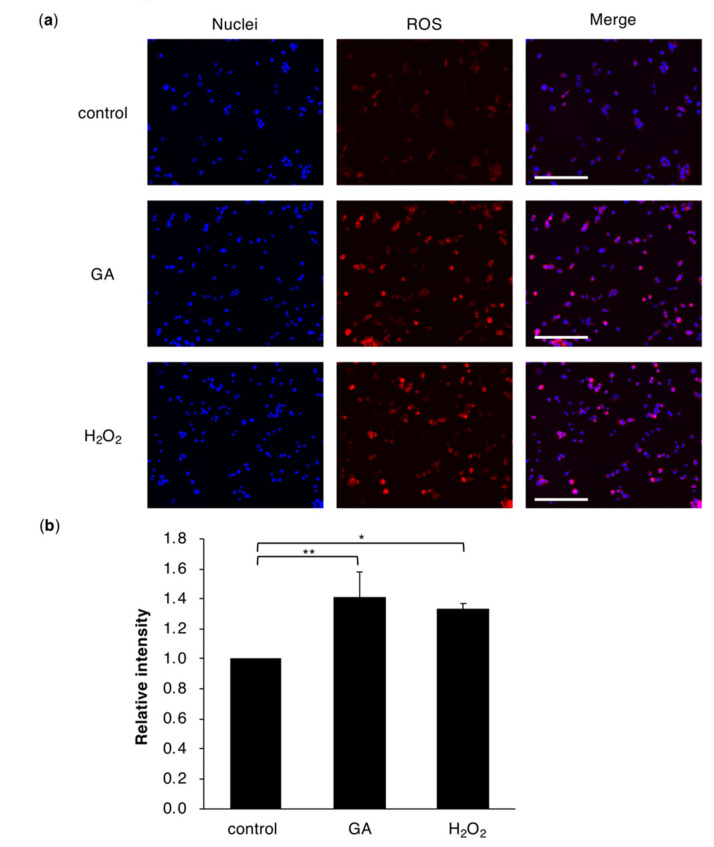
Figure 2.
ROS accumulation in HepG2 cells treated with GA. (a) Representative fluorescence images of nuclei (Hoechst 33342; blue fluorescence) and ROS formation (OxiORANGE; red fluorescent) in HepG2 cells. Magnification for the figure is ×20. Cells were prepared from HepG2 cells treated with 0 or 4 mM GA or 1 mM H2O2 for 6 h. Experiments were repeated in triplicate with similar results. Scale bar = 200 μm. (b) The relative fluorescence intensity of HepG2 cells in each group. Results are mean ± S.D. * p < 0.05 and ** p < 0.01 (n = 3) based on a one-way ANOVA followed by Dunnett’s test.

