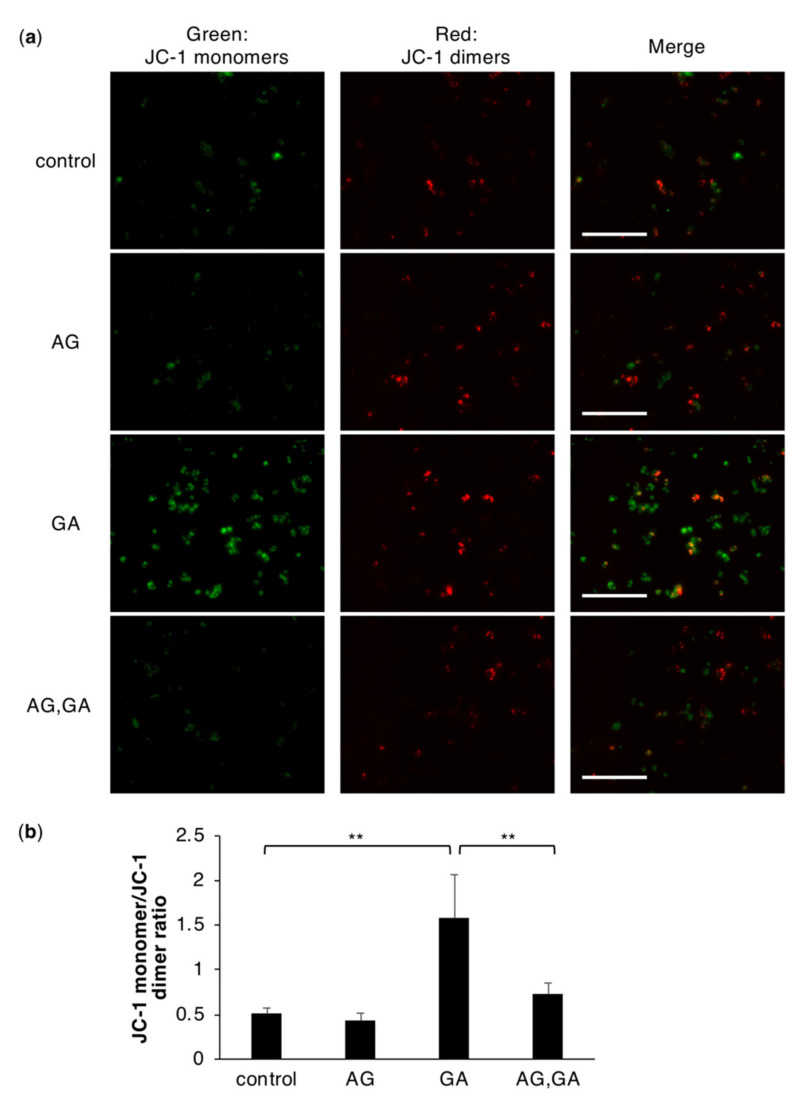
Figure 5.
Mitochondrial membrane depolarization in HepG2 cells treated with GA. (a) Depolarization of the mitochondrial membrane potential was observed (the magnification for the figure is ×20) after cells were treated with 0 or 16 mM AG for 2 h followed by 0 or 4 mM GA for 6 h. Scale bar = 200 μm. (b) The relative fluorescence intensities of JC-1 monomer/JC-1 dimer. Results are mean ± S.D. ** p < 0.01 (n = 3) based on a one-way ANOVA followed by Tukey’s test.

