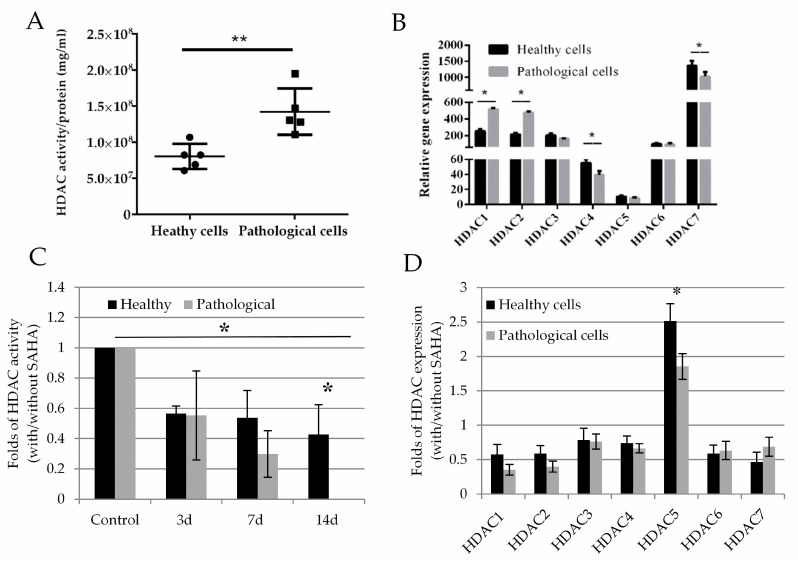
Figure 4.
HDAC activity and gene expression profile in healthy and pathological hmMSC. (A) HDAC activity in healthy and pathological hmMSC (arbitrary fluorescence units/per protein (mg/mL), n = 5. (B) Relative expression (2−ΔCT) of HDAC1–7 genes in healthy and pathological hmMSC, n = 3. Changed HDAC activity (C) and HDAC1–7 gene expression (2−ΔΔCT) (D) in healthy and pathological cells after exposure to 1 µM of SAHA for three days, n = 3. Gene expression was analyzed as follows: expression = 2−ΔCt × 100,000, where ΔCt = (Cttarget gene − Ctreference gene); relative expression = 2−ΔΔCt, where ΔΔCt is a subtraction of ΔCt of control cells from ΔCt of cells treated with SAHA. Data are shown as mean ± standard deviation (SD). The * p ≤ 0.05, ** p ≤ 0.01, n = 3–5 from 3 experiments. Student t-test was calculated by an Excel and Graphpad Prism 6 programs.

