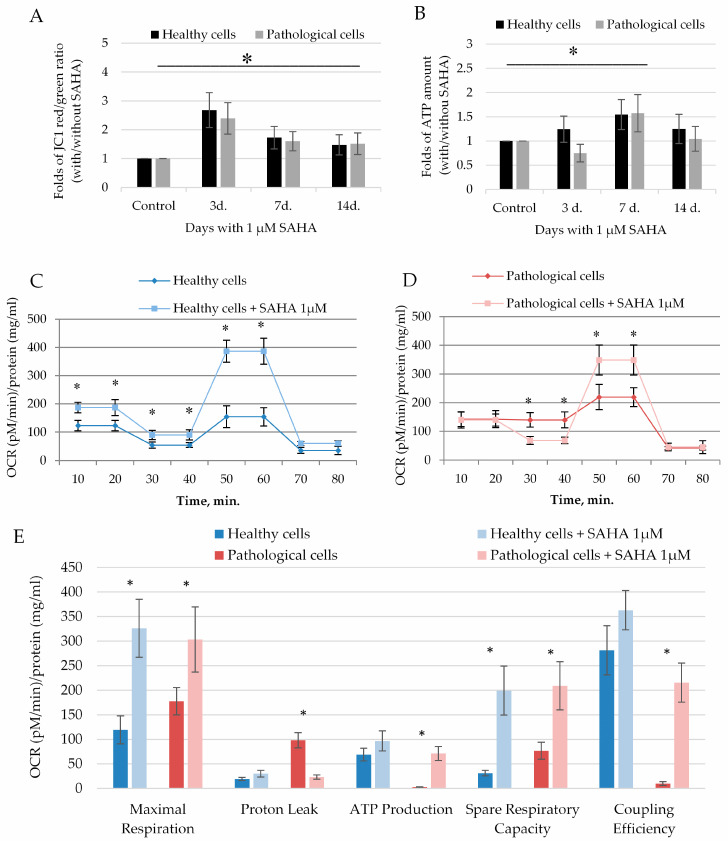
Figure 5.
SAHA enhances the energetic status of healthy and pathological hmMSC. Mitochondrial membrane potential (A) and ATP production (B) in healthy and pathological hmMSCs exposed to 1 µM of SAHA for three days. Changes of oxygen consumption rate (OCR) ((pM)/protein (mg/mL)) in healthy (C) and pathological (D) cells and calculated mitochondrial parameters (E) after exposure to SAHA. Data are displayed as fold of changes with and without SAHA. Control–cells of both types not affected by SAHA. Data are shown as mean ± standard deviation (SD). The * p ≤ 0.05, n = 3 from 3 experiments. Student t-test was calculated by an Excel program.

