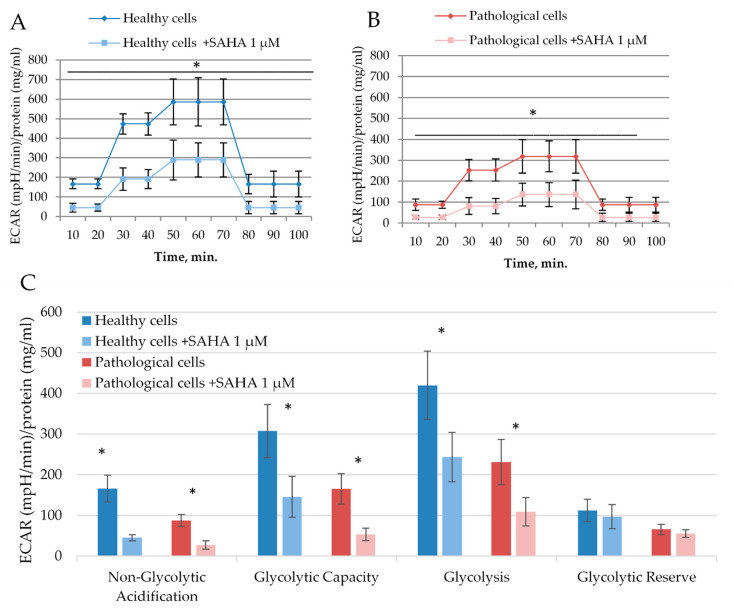
Figure 6.
The effect of SAHA on glycolysis of healthy and pathological hmMSC. Decrease of extracellular acidification rate (ECAR) ((mpH/min)/protein (mg/m)) in healthy cells (A) and pathological (B) cells after exposure to 1 µM of SAHA for three days. (C) Quantification of glycolytic stress parameters in healthy and pathological hmMSC with and without SAHA. Data are shown as mean ± standard deviation (SD). The * p ≤ 0.05, n = 3 from three experiments. Student t-test was calculated by an Excel program.

