Figure 7.
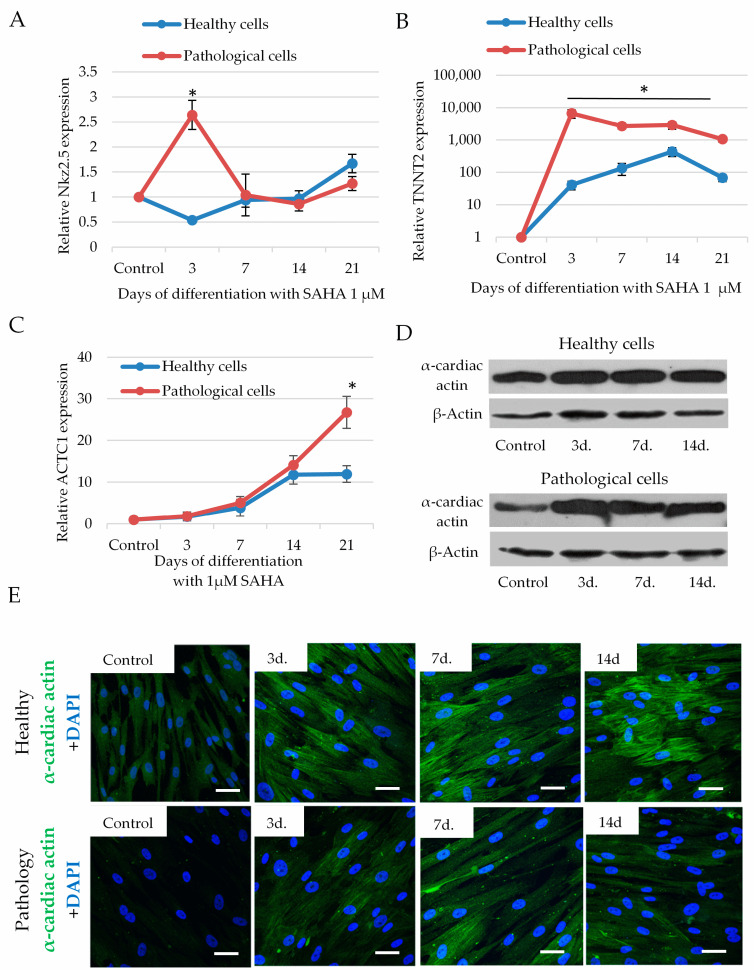
The impact of SAHA on the levels of transcription factor transcription factor NK2 Homeobox 5 (Nkx2.5), cardiac troponin T (TNNT2) and alpha cardiac actin (ACTC1), in healthy and pathological hmMSC. (A) Expression of Nkx2.5 gene (2−ΔΔCT) in healthy and pathological cells during 3–21 days of cultivation with 1 µM of SAHA. (B) Expression of TNNT2 gene (2−ΔΔCT) in healthy and pathological cells during 3–21 days of cultivation with 1 µM of SAHA. (C) Expression of ACTC1 gene (2−ΔΔCT) in healthy and pathological cells during 3–21 days of cultivation with 1 µM of SAHA. (D) Level of alpha cardiac actin protein compared to beta actin in healthy and pathological cells after exposure to 1 µM of SAHA analyzed by Western blotting. (E) Immunocytochemical micrographs of alpha cardiac actin levels in healthy and pathological cells after exposure to 1 µM of SAHA for 3–14 days, scale bar = 20 μm. Control-healthy and pathological cells without SAHA. Gene expression was analyzed as follows: expression = 2−ΔCt × 100,000, where ΔCt = (Cttarget gene − Ctreference gene); relative expression = 2−ΔΔCt, where ΔΔCt is a subtraction of ΔCt of control cells from ΔCt of cells treated with SAHA. Data are shown as mean ± standard deviation (SD). The * p ≤ 0.05, n = 3 from three experiments. Student t-test was calculated by an Excel program. (D) and (E)—representative blots and micrographs are shown.

