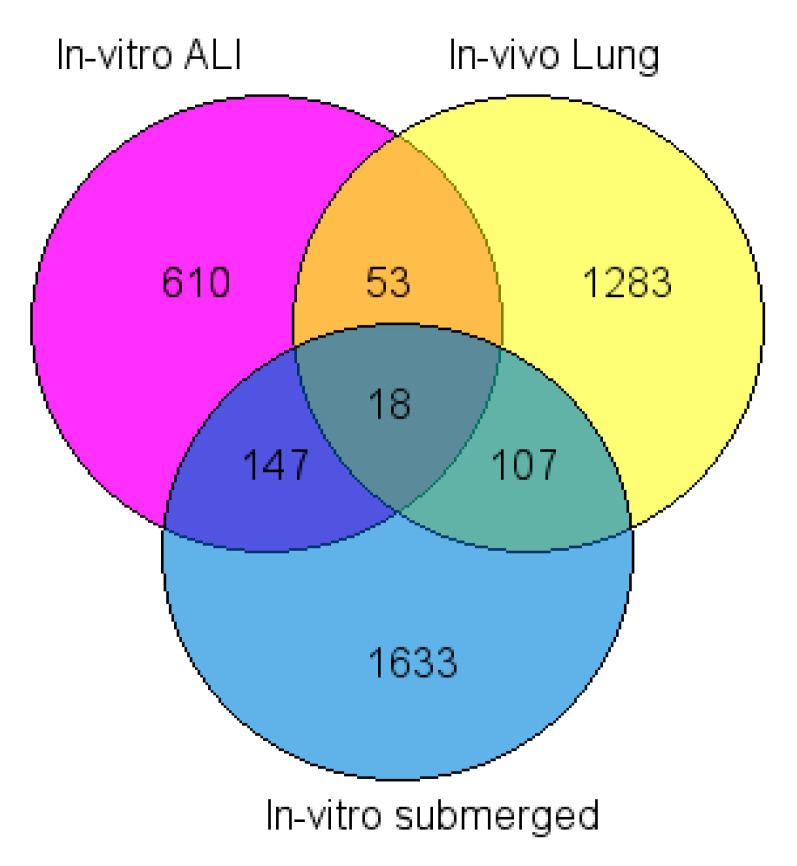
Figure 4.
Venn diagram of differentially deregulated genes after TiO2 NP in vivo (lung), in vitro submerged and ALI (Vitrocell) exposures (FDR corrected p-value < 0.05). Genes were filtered with different fold change cutoff: In vitro submerged: 2.8, In vitro ALI Vitrocell: 1.3 and In vivo lung: 1.3.

