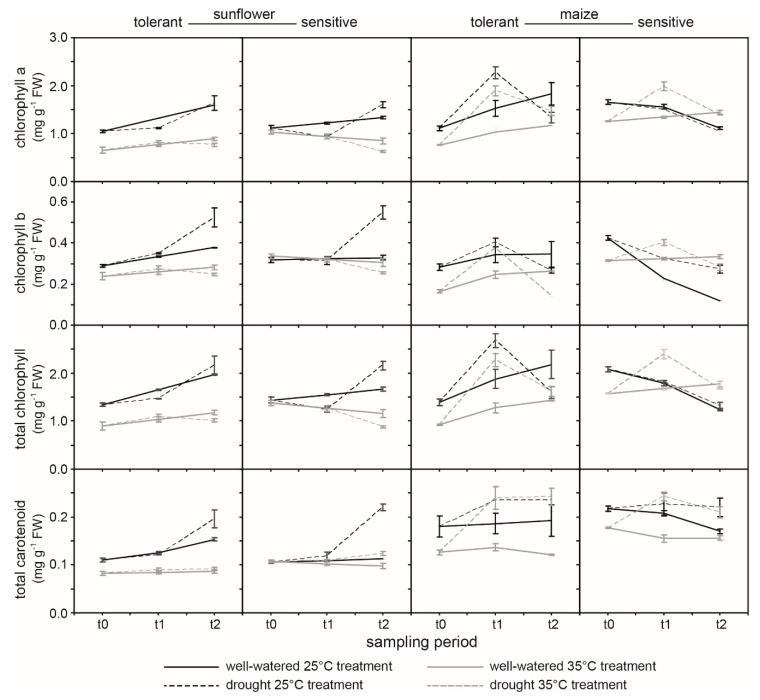
Figure 5.
Chlorophyll a, chlorophyll b, total chlorophyll, and total carotenoid content in drought-tolerant and -sensitive varieties of sunflower and maize exposed to soil drying at 25 and 35 °C at three sampling points (t0, t1, t2). The solid unbroken line indicates well-watered control plants, and the dashed line indicates drought plants. The black line indicates the 25 °C treatment, and the gray line indicates the 35 °C treatment. Differences in homogenous groups for each species (maize and sunflower separately) were determined using a one-way ANOVA and LSD post-hoc test, which are provided in supplementary data (see Supplementary Data Table S2).

