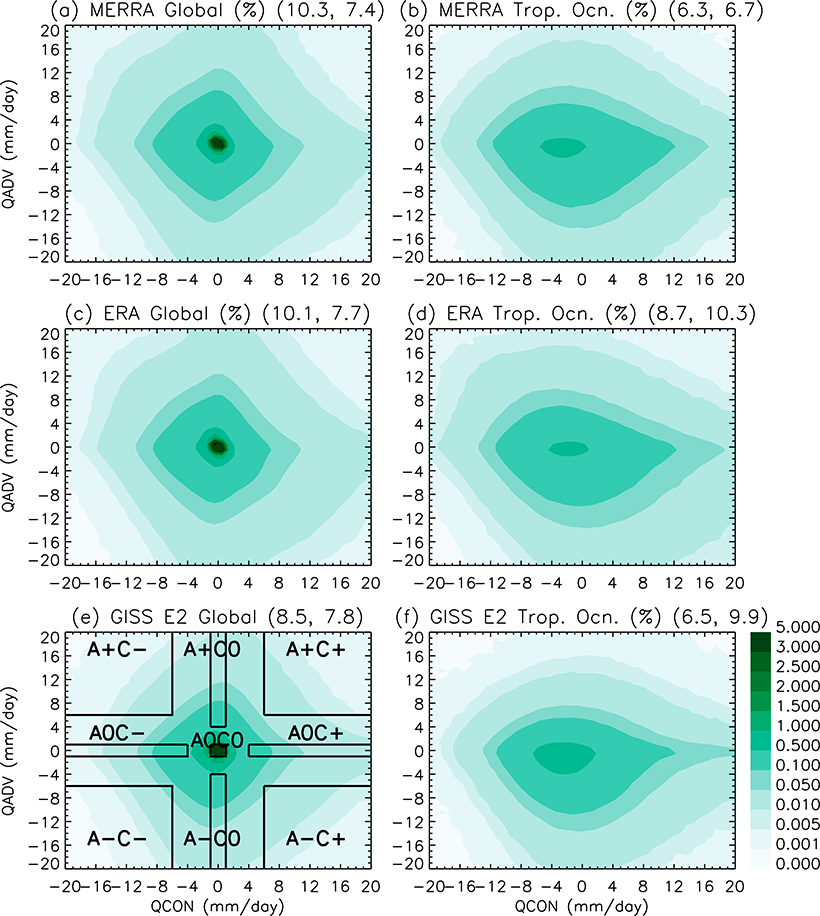
FIG. 2.
Joint histograms of QCON (mm day−1) and QADV (mm day−1) for (a),(b) MERRA, (c),(d) ERAi, and (e),(f) GISS-E2 for 2007–09. Standard deviations of QCON and QADV are listed in the titles of each panel. The color shading indicates the probability (%) for (left) over the whole globe and (right) over the tropical oceans. Different dynamical regimes are defined by black boxes in (e) and labeled as A+C−, A+C0, A+C+, A0C−, A0C0 (the quiet zone), A0C+, A−C−, A−C0, and A−C+.

