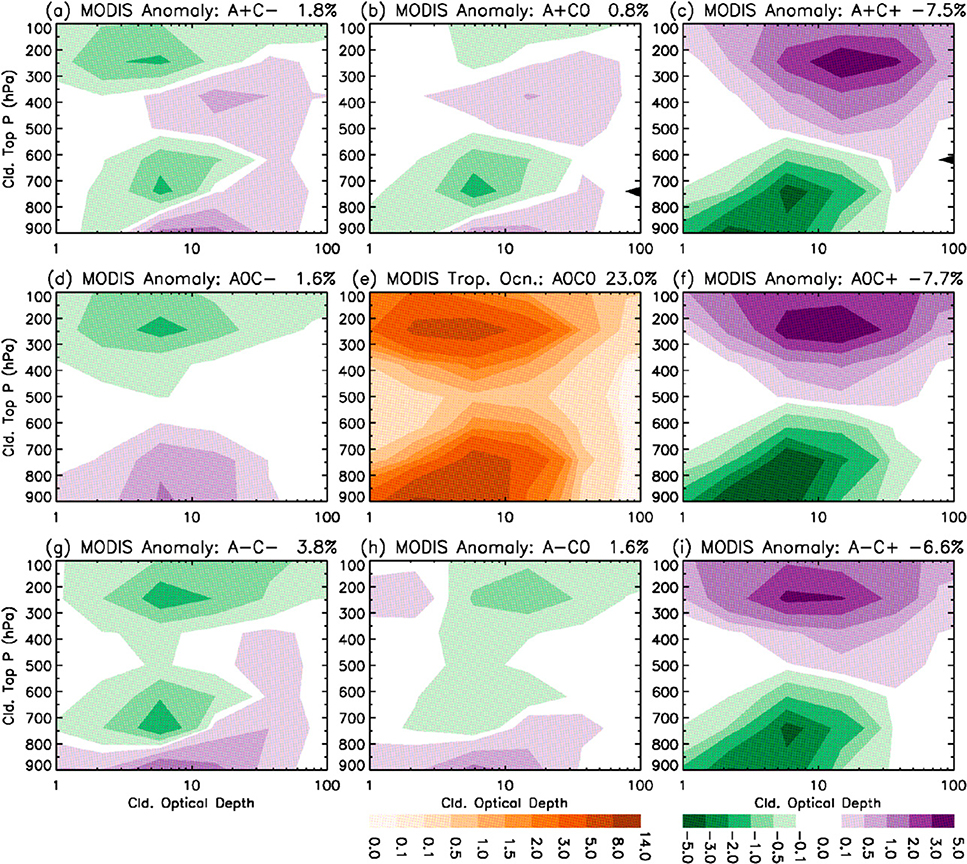
FIG. 5.
Cloud state histograms (occurrence frequencies, %), spanned by MODIS CTP (ordinate) and COD (abscissa), sorted by the nine dynamical regimes over the tropical oceans. (e) The histogram for the quiet zone with the clear sky occurrence frequency shown in the panel title. Panels surrounding (e) are anomalous occurrence frequencies from those of the quiet zone for the other eight dynamical regimes, with the anomalous clear sky occurrence frequencies shown in the corresponding panel titles. The dynamical regimes are defined by the MERRA QCON and QADV. The labels of the nine dynamical regimes are in the panel titles, and the regimes defined in Fig. 2e.

