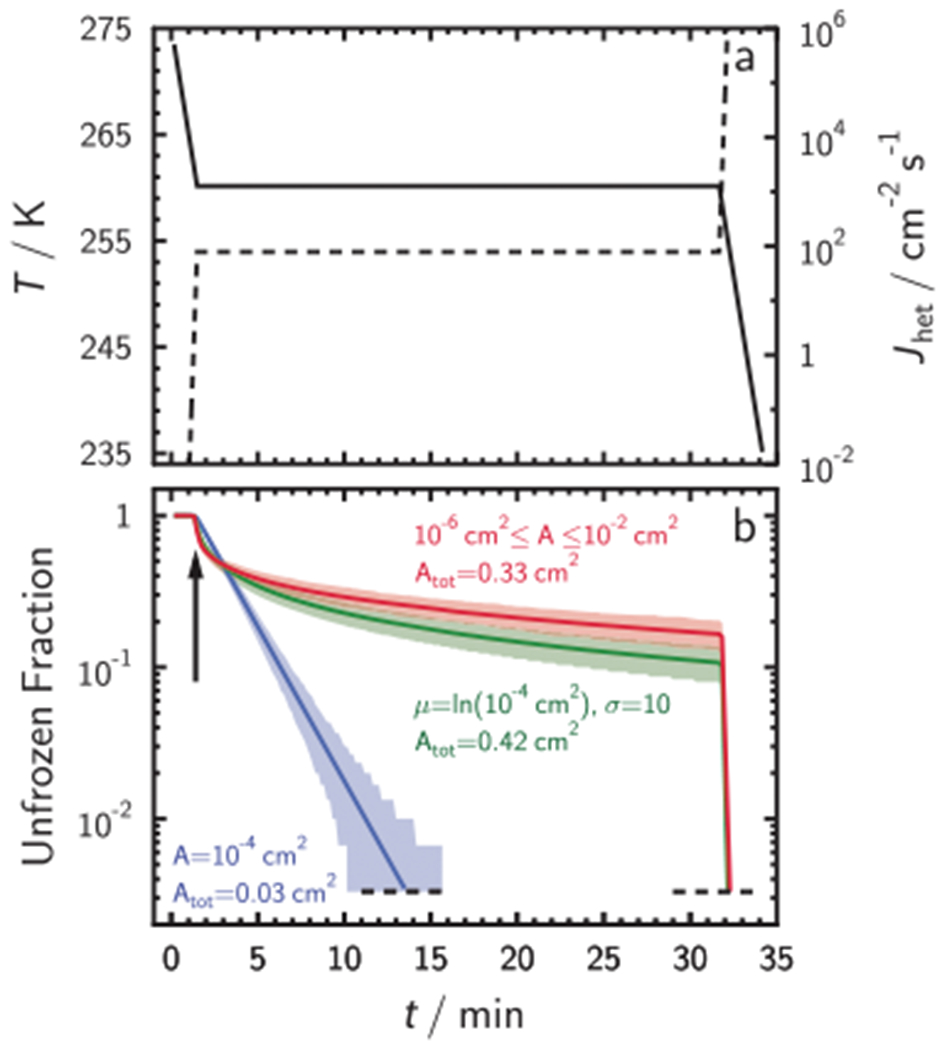
Fig. 1. Isothermal immersion freezing experiment.

a A typical experimental temperature, T, profile over time, t, (solid line) where the droplets are held constant after an initial cooling ramp. At about t = 31 min, T is further decreased to induce freezing in all droplets. Dashed line shows an example of the corresponding heterogeneous ice nucleation rate coefficient, Jhet. b Exemplary profile of the unfrozen droplet fraction as a function of t derived from simulating freezing using 300 droplets. The blue solid line represents simulated unfrozen droplet fraction assuming identical ice nucleating particle surface area, ISA, of A = 10−4 cm2 in each droplet. The green line represents the case of a lognormally distributed ISA around A, with σ = 10. The red line is a case where ISA is uniformly distributed by ±2 orders of magnitude in ISA around A. All curves apply the same Jhet depicted in a. Shaded areas represent 5th and 95th percentiles.22,25 Total surface area, Atot, is indicated. The arrow indicates the t from which on the T is constant. Horizontal dashed lines indicate the limit of detection equal to 1/300 droplets.
