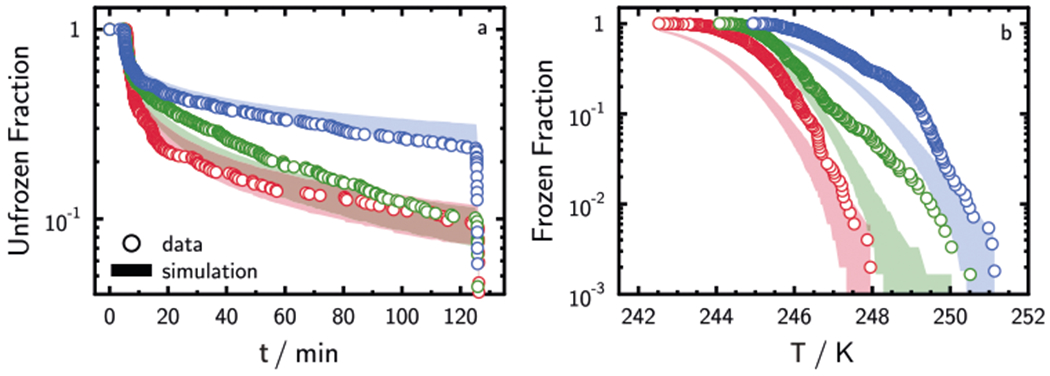
Fig. 2. Isothermal and constant cooling rate immersion freezing experiments.

Experimentally derived (symbols) and simulated (shading) unfrozen fractions of isothermal freezing experiments (a) as a function of time, t, and frozen fractions of constant cooling rate freezing experiments (b) as a function of temperature, T, outlined in Supplementary Table S1. Immersed surface area per droplet is unknown and lognormally distributed in model (see Supplementary Table S2). Blue color represents ISO1 and CCR1, green color represents ISO2 and CCR2, and red color represents ISO3 and CCR3. Shadings represent the modeled 5th and 95th percentiles.
