
Fig. 7. Example experiment of a perfect ice-active particle population following the time-independent description.
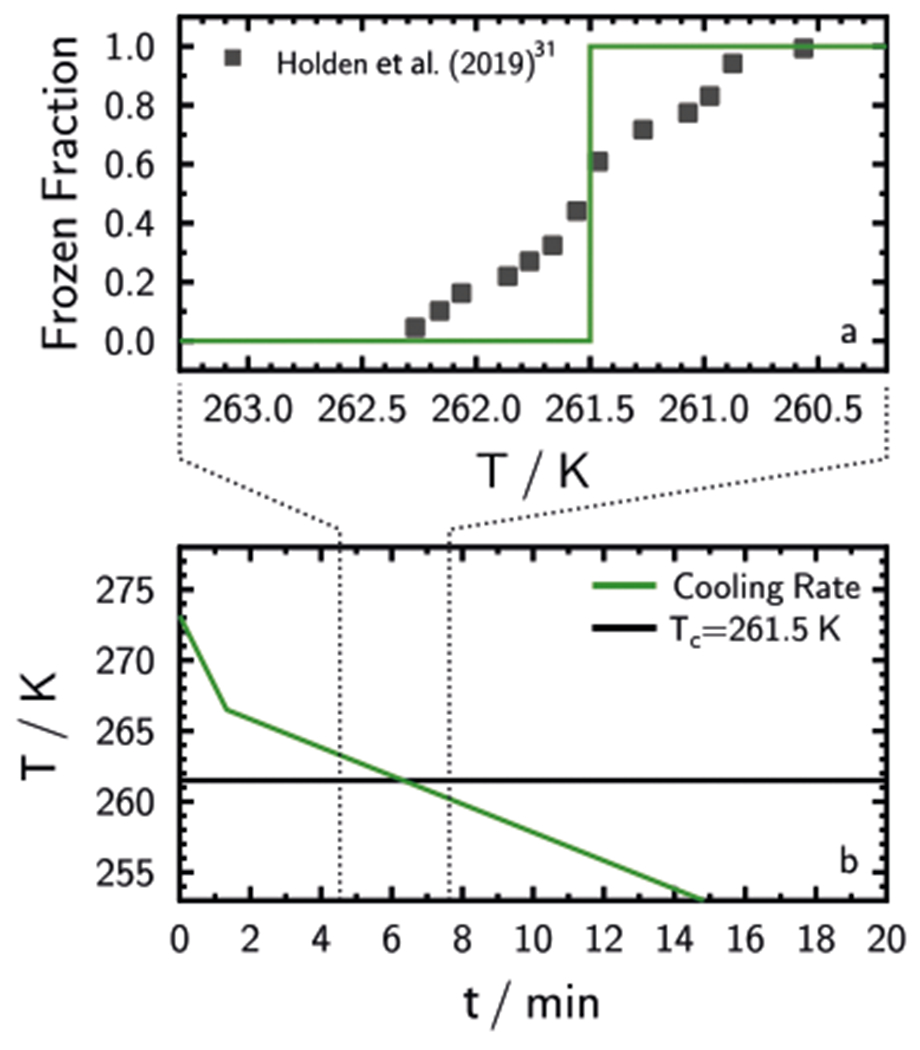
The green line in a and b shows the frozen fraction for a cooling rate experiment and the experimental temperature, T, profile over time, t, respectively. The characteristic temperature at which all ice-active sites on particles nucleate ice, Tc, is indicated. Note that b is enlarged to show a longer time period. Squares in a show the frozen fraction for a single nucleation site.31