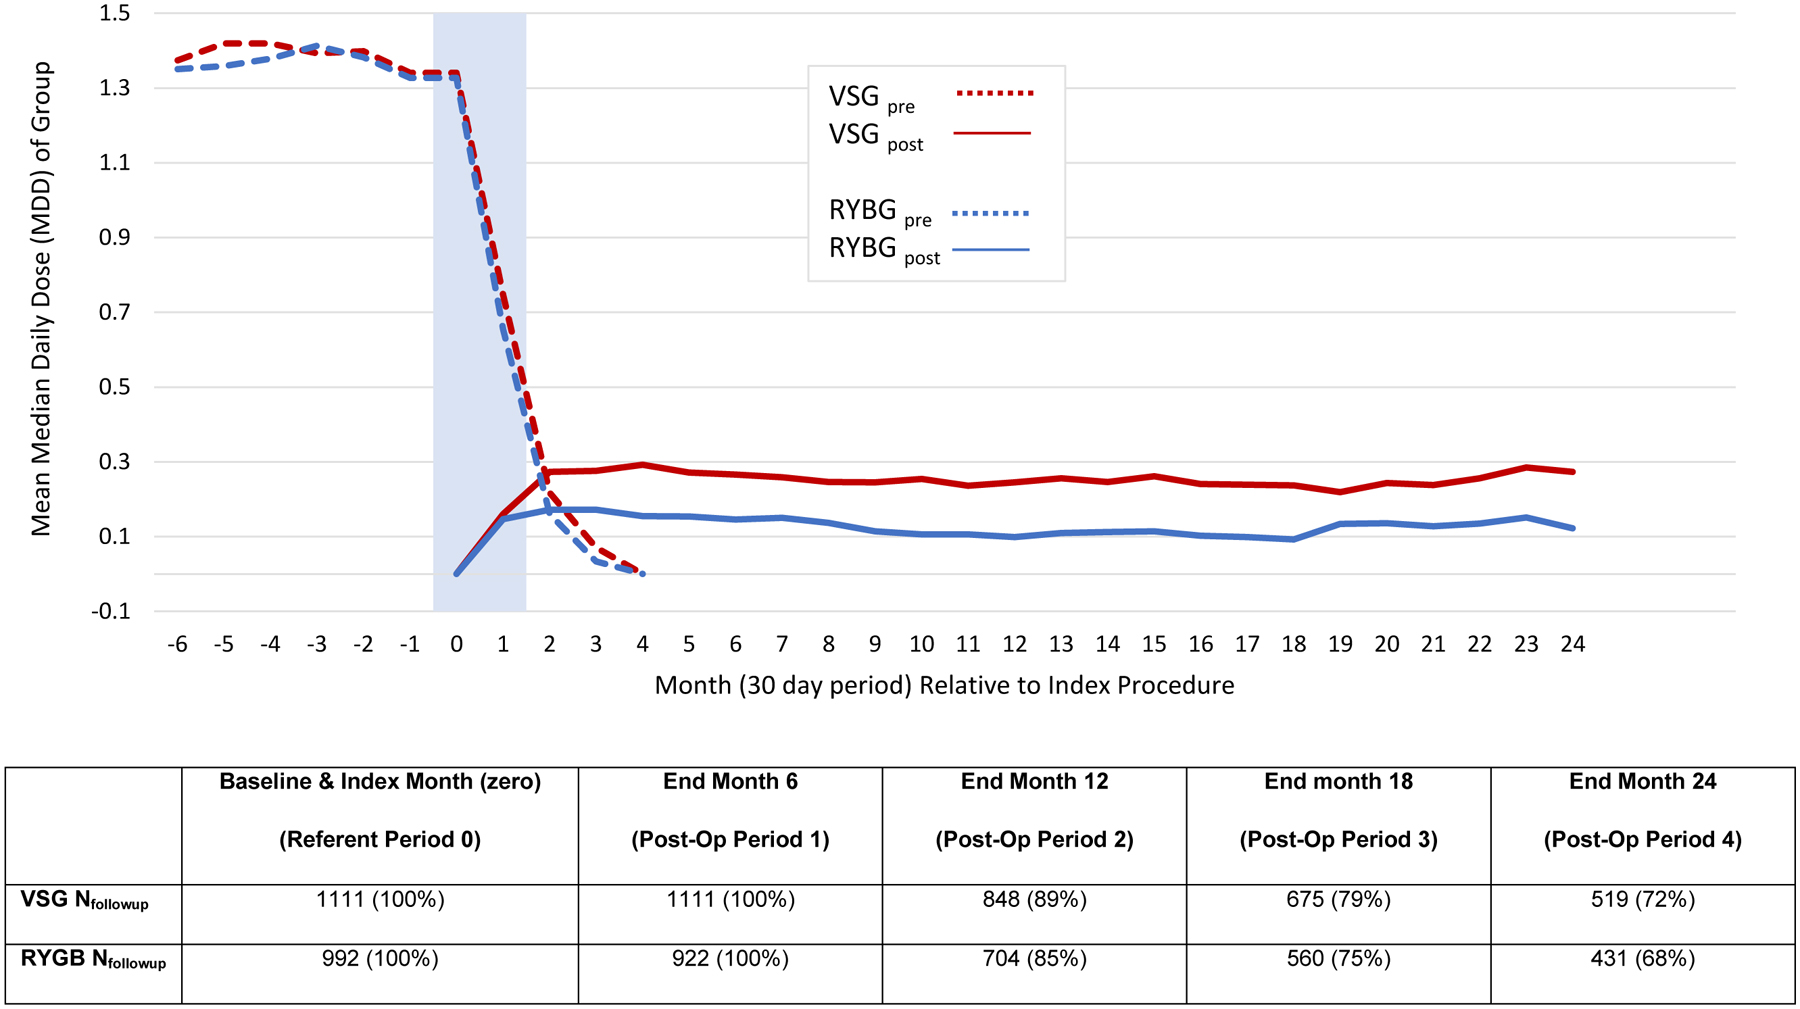
Figure 3: Adjusted Time Series Plot of Median Daily Dose (MDD) for All Diabetes Medications Combined, Before and After Surgery, Comparing Matched Cohorts of VSG and RYGB Patients.

Curves represent the average adjusted MDD for all combined diabetes medications (including oral, insulin and other injectables) by group, per month (30 day period – shown on x-axis) from 6 months before, through 2 years after surgery. Preoperative curves (dashed lines, starting far left) illustrate MDD for medications that patients had on-hand before surgery, supplies that are gradually exhausted by up to 3 months after surgery. Postoperative curves (solid lines, emerging at index month) illustrate MDD for medications newly supplied and on hand beginning on the date of surgery forward, thus increasing from month 1 to 3. The semi-transparent blue rectangle represents the immediate perioperative period (index date through day 30) which we treat as the primary washout period to allow for time for most medication on hand as of the index date (preoperative supply) to be used up, and owing to some patients receiving a one-time fill for medications on or around the day of surgery. See Table 3 for statistical comparisons of between procedure changes in MDD from pre- to post-surgery. Completeness of follow-up is detailed below the graph, with Nfollowup by group indicating the number (%) of patients with complete enrollment data (i.e. not lost to follow-up) at each time point, relative to a denominator of patients who should have had sufficient follow-up time to contribute at each time point.
