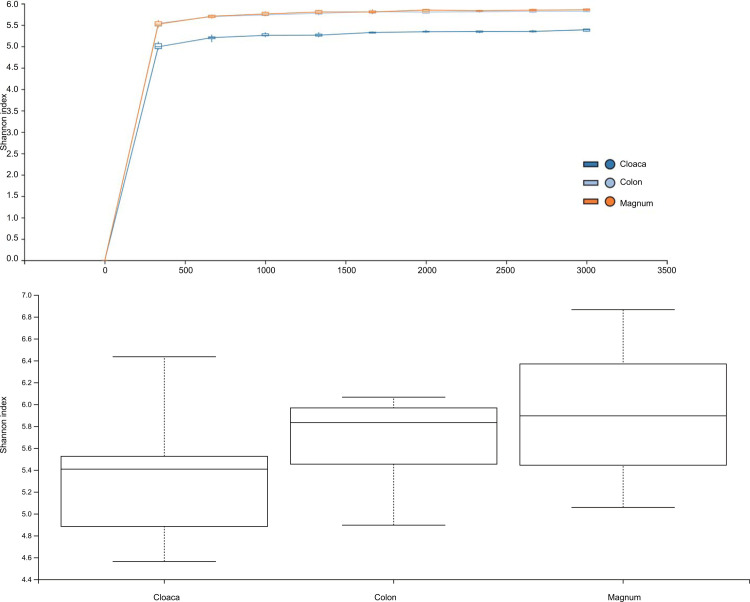
Fig 1. Comparison of the Shannon index between the cloaca, colon, and magnum.
Microbiota in the cloaca, colon, and magnum of SPF laying hens were analyzed via Shannon’s index. (A) Rarefaction curve for Shannon's index. The dark blue line represents the cloaca, the orange line represents the magnum, and the light (sky) blue line represents the colon. (B) Shannon's index for each group. Box plots show the quartiles, median, and extremities of the values.

