Fig 9.
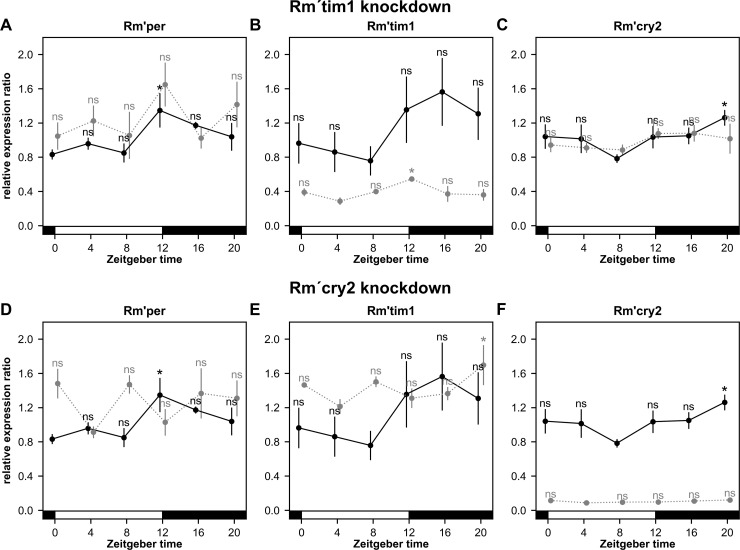
A-F. Except for Rm´tim1 both, dsRNA-dependent downregulation of Rm´tim1 (A-C) or of Rm´cry2 (D-F) abolished cycling of mRNA levels of both other circadian clock genes examined. Solid lines represent control animals, dotted lines Rm´tim1 (A-C) or Rm´cry2 (D-F) dsRNA injected animals respectively. Relative expression ratios are analyzed compared to the lowest value of the respective curve. Relative expression ratios of Rm´per (A), and Rm´cry2 (C),but not Rm´tim1 (B)cycled ZT-dependently in controls (n = 3 per Zeitgeber time (ZT) in each group).Minima in mRNA levels of the controls are at ZT 0 (Rm´per) and at ZT 8 (Rm´tim1, Rm´cry2). Expression maxima in controls occurred at the beginning of the night (ZT 12; Rm´per), the middle of the night (ZT 16; Rm´tim1), or the end of the night (ZT 20; Rm´cry2).Successful knockdown of Rm´tim1 to ~40% of WT mRNA levels deleted rhythmic expression of Rm´per (A) and Rm´cry2 (C), but not of Rm´tim1 (B). Knockdown of Rm´cry2 to ~10% of WT levels deleted rhythmic expression of Rm´per (D) and Rm´cry2 (F), but not of Rm´tim1 (E). Whole brains of cockroaches at different ZTs in 12:12 LD cycles were collected for qPCR experiments. The bars at the bottom of the plots indicate light (white) and dark (black) phases. A linear mixed model was used to determine significant differences within groups. The ZT with the lowest data points within each curve was always compared with all other ZTs of the curve. Error bars represent standard errors. ns = not significant;*: p<0.05.

