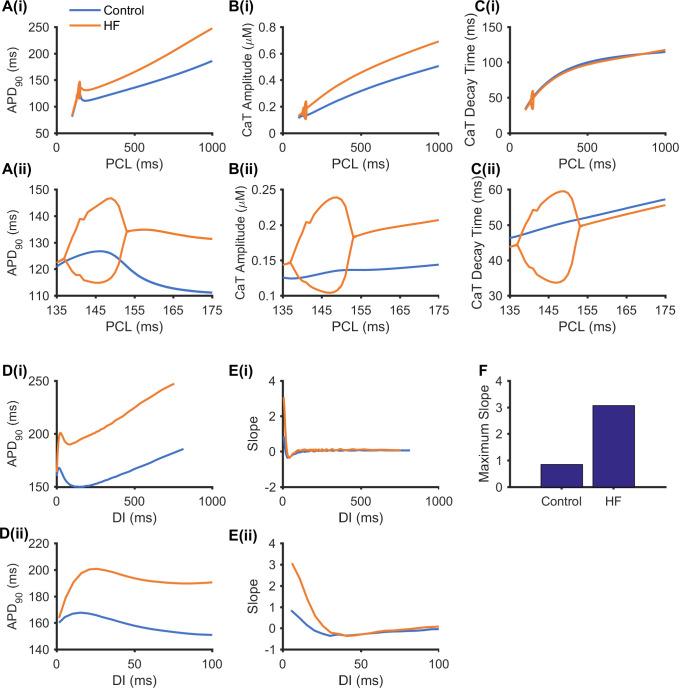
Fig 3. Effect of HF-induced electrical remodelling on rate dependent curves and the restitution curves.
(A) APD90 rate dependent curves, (B) CaT amplitude rate dependent curves, and (C) CaT decay time rate dependent curves from two consecutive beats in a quasi-steady state under control (shown in blue) and HF (shown in orange) conditions. (D) APD90 restitution curves at a quasi-steady state under control (blue) and HF (orange) conditions. (E) Slopes and (F) maximum slope of the restitution curves in (D). (ii) Enlarged view of (i) to more clearly reveal the PCL range with alternans.

