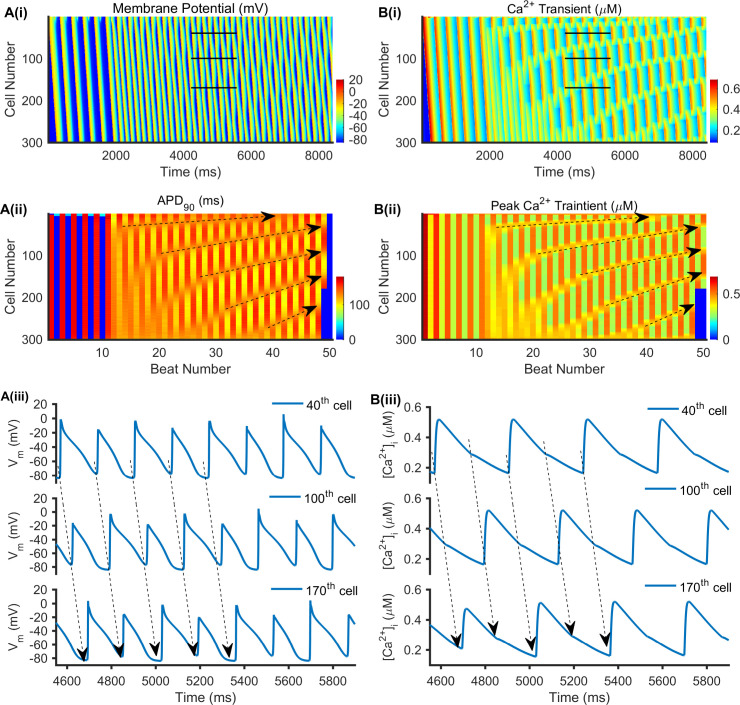
Fig 7. Representative 1D simulation of the discordant alternans with D = 0.028 mm2/ms at a PCL of 168 ms in HF.
(A(i)) Time-space plot of the membrane potential of a homogeneous, 1D cable. (A(ii)) The corresponding APD90 of each beat, in which black dashed lines with arrows indicate the APD node position as the beat number increases. (A(iii)) Time course traces of AP for the 40th, 100th, and 170th cells, which are marked with black lines in (A(i)). (B(i)) Time-space plot of the Ca2+ transient in a homogeneous, 1D cable. (B(ii)) The corresponding peak Ca2+ transient of each beat, in which black dashed lines with arrows indicate the peak Ca2+ transient node position as the beat number increases. (B(iii)) Time course traces of Ca2+ transient for the 40th, 100th, and 170th cells, which are marked with black lines in (B(i)).

