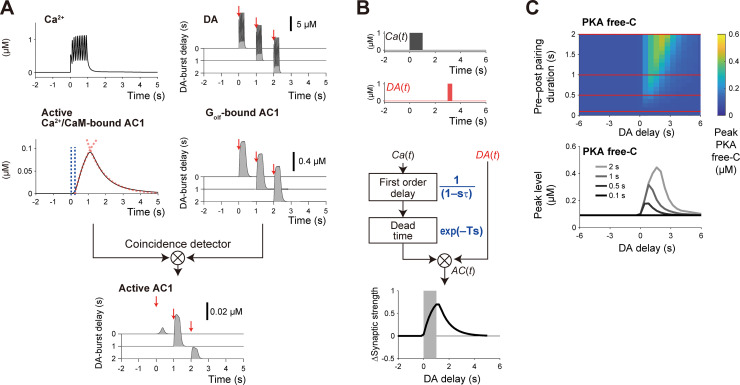
Fig 3. Delayed activation of AC1 for temporal contiguity detection.
(A) Pre–post pairing stimulated AC1 through Ca2+/CaM signal with two types of time lags, i.e., dead time (period between blue dotted lines) and first-order time constant (red dotted lines), and Ca2+-stimulated AC1 was activated only during DA burst through Golf binding (right). DA bursts at particular times are plotted (red arrows, 0 s, 1 s, or 2 s). (B) Time window in a simple control model of AC1. Ca2+ signal [Ca(t) = 1 (0 < t ≤ 1), 0 (otherwise)] was first passed through a first-order time constant [1/(1+τs)] then a dead time [exp(−Ts)] before AC1 was stimulated. DA signal [DA(t) = 1 (tdelay < t ≤ tdelay + 0.3), 0 (otherwise)] directly stimulated AC1. Here, T is the dead time (0.3 s), τ is the first-order time constant (2 s), and tdelay is the DA delay. The time integration of AC(t) corresponds to PKA Free-C or ΔSynaptic strength. (C) Pre–post pairing (Ca2+-signal) duration dependence of the peak amplitudes of PKA-free C in the detailed D1 RP model. The peak PKA free-C values at the red horizontal lines are shown in the bottom panel.

